Archive
Weekend Update April 23rd, 2011
Zweig Breadth Thrust at 58.79, which is confirming the move. A rally on Monday will probably push ZBT back above 60. When this happened recently, the market did a slow roll into last Monday’s low.
4wk New High/Low Ratio at 86.91 and like ZBT is confirming the current move. This only reached 90 back at the end of March and first of April and would probably need a rally on Monday and Tuesday to push this 90. If the market should rally throughout the week, then this might get up close to 95, which is considered extremely overbought.
$VIX has closed below its lower BB for the past two sessions. Normally this would be a red flag with a ‘sell’ signal coming when $VIX closes back inside the BB and above the high of the candle that preceded the close, which in this case would be 15.83. At the moment I’m leery of this set up mainly because of what happened to $RVX and IWM last week.
If you remember, $RVX closed below its lower BB on 4/15 and then the market fell off a cliff on Monday, the 18th, but this turned out to be a total head fake rather than a legitimate ‘sell’ signal for IWM. I’m thinking the same thing could happen to the $VIX and $SPX. Time will tell.

Sell in May and go away?
There have been summer sell offs in six of the last eight years, going back to 2003. These pull backs began anytime between the 1st of May and mid-June. Some were minor and some, like the drop in 2008, were substantial. On the far left side of the chart below of IWM, you can see two more summer pull backs. All of this suggests that there may be a pull back of one degree or another starting some time in the next 30-40 days, if not sooner.
IWM Monthly Chart:
I mentioned the $RUT monthly chart a few weeks back and the chart below shows what I’m looking at. If you notice on the chart the number of red arrows that line up with times when the RSI has tagged or pushed above 70. Most of those situations have resulted in some kind of consolidation period or pull back lasting for varying amounts of time. With the RSI now at 67, it’s going to take quite a rally from current levels to push the RSI up to 70. Unless IWM screams higher before next Friday, that isn’t going to happen in April. But it may happen in May, or not. Just something to watch.

Next weekend I will put up my last post and go dark.
GL in the week ahead.
Weekend Update April 16th, 2011
Is this love or just confusion?
Sure seems that everyone loves the Russel. Maybe they love it a little too much. 60min chart sure looks good and meets all the criteria for a ‘buy’ signal per the 60min trading strategy. 72% of the stocks in the $RUT closed in the green on Friday. Disclosure: I am not long IWM, UWM, or TNA, but maybe I should be.

Chart courtesy of FreeStockCharts.com
According to the 5/10 method, IWM should give a ‘buy’ signal on Monday.
But here is the problem I see. $RVX has closed below its lower BB and is now at levels similar to those from April 2010. The big difference between last April and this April is the fact that the BB’s on $RVX were compressing. Still, a ‘sell’ signal comes when $RVX closes back inside the lower BB.

Chart courtesy of StockCharts.com
What this set up says to me is that the $RUT may pull back a little in the week ahead, though from what level is anyone’s guess, and that a better entry level could present itself. At the moment, and subject to change without notice, I am more interested in adding to long positions rather than selling out completely; however, there are going to be a ton of earnings this week and if the market doesn’t like what it hears, then that’s another story.
Intervention is just another word for manipulation.
GL in the week ahead.
Weekend Update January 16th, 2011
First, this article from Carl Swenlin at Decision Point suggests that the market has priced in most of the expected earnings gains through the 3rd quarter of the year, not that it makes any difference.
The market continues as a self-fulfilling prophecy where every buyer gets instant gratification which pulls other buyers in from the cheap seats who then experience the same gratification. These buyers, without exception, anoint themselves as stock market geniuses who then start up a newsletter charging several hundred $$’s a month. Hmm. Gives idea.
Meanwhile, with the exception of metals and bonds, trend lines are holding and every sector that starts to flounder is pounced upon and bought right back up. Wash, rinse, repeat. Or not.
$BPSPX, $BPINDY, $BPMATE, $BPTRAN all flat for the week while $BPNDX rose to 89. $BPNDX went to 93 in early Sept of 09′ so there’s still some head room left. Scroll down to last weekend’s post about these Bullish % indexes because basically we’re still in the same boat.
Volatility: $VIX, $VXN, $VXO, $VXD, $QVV all dropped to or very close to their recent closing lows and the April 2010 closing lows. They also tagged their lower BB’s, but this hasn’t mattered lately so no idea if it will matter this time. Since neither $RVX nor $VIX:$VXV tagged their lower BB’s, then I think this probably lessens the importance of the BB tags by the other volatility indexes.
$CPC & $CPCE: Cobra’s chart (scroll down to Friday’s post for a link) shows that these two P/C Ratios have hit levels not seen since April of 2010. Back in August, the $CPCE closed at .39 but it did not have the confirmation of the $CPC, and that, as I have discovered through some back testing, is key to this signal. If this current signal is going to work, then we won’t know for several days. Back in April of 2010 when $CPC closed at .56 and $CPCE closed at .32, the market rallied for two more weeks before dropping into the July lows. A few days after these low readings, the markets experienced a serious one-day decline which set the stage for later declines. Unfortunately in this market history is of little or no use so that may be the case this time, as well.
I back tested $CPCE and $CPC to 2003, which is as far back as I can find data for $CPCE. The key to this setup is that there must be confirmation by both of the P/C ratios, and here is what I found:
December 30th, 2003- $CPCE .37, $CPC .52
January 16th, 2004- $CPCE .37, $CPC .51
From December 30th, 2003, $SPX would rise 40pts peaking around 1150 on January 26th, 2004. $SPX then dropped to 1122 and attempted to resume the rally, reaching 1163 in early March. From there it dropped 100pts, finally bottoming in August. During this same time period $TRIN 55/89 MA set up went to 1.02/1.05, respectively, on January 16th.
January 24th, 2006- $CPCE .37, $CPC .58
On January 19th, 2006, $SPX closed at 1285. On January 20th, it dropped to 1261. On the 24th, $SPX closed at 1266. $SPX would then rally to 1285 but rolled over and fell back to 1255. After that the rally resumed. $TRIN 55/89 setup went to .97/1.01, respectively, on December 21st, 2005.
August 21st, 2009- $CPCE .39, $CPC .59
On Friday, August 21st, 2009, $SPX closed at 1026. During the following week, it managed to close 4pts higher on August 27th. Starting on August 28th and ending on September 2nd, $SPX would drop 36pts after which the rally resumed. $TRIN was not a factor.
April 14th, 2010- $CPCE .32, $CPC .56
On April 14th, $SPX closed at 1210. Two days later, $SPX dropped to 1192 on very heavy volume. Over the course of the next week or so, $SPX rose to 1217, and then the wheels came off. $TRIN 55MA went to 1.04 while 89MA never reached overbought levels.
Other factors that play into this scenario are the Bullish %’s, (see last weekend’s post) $VIX and $NYSI/$NASI. I have not had a chance to look at the $VIX but I remember how the $VIX blew through its lower BB in the mid-April period of 2010 and you can see on the chart below that during the late March/early April period of 2010 $NYSI was putting in small candles and that the 5,3,3 Stochastic peaked and was rolling over. $NYSI was also producing small candles in August of 2009.
January 14th, 2011- $CPCE .37, $CPC .57 with $TRIN 55/89 setup at .99/1.01, respectively, $VIX tagging its lower BB, and $NYSI hinting at a loss of momentum.
So, what’s next? I have absolutely no idea. Really. If history is of any use at all, then the market is going to pull back and that pull back should begin no later than two weeks from now. In between now and the pullback, assuming there is one, there should be some overt sign of distribution as the Big Boyz hit the exits. The problem and wild card in all this is that most of these previous pull back signals, with the exception of April 2010, all occurred B.P., Before POMO, and there is a problem in the bond market which is bringing money into equities. Regardless of what happens in the next couple of weeks, I do not think the rally is in jeopardy. I think a cooling off period is in order, but I’ve been thinking that for quite a while and a broken clock is right twice a day, yada, yada, yada. I mean, how can you argue with a chart that looks like this?
Bond market: Back in 2003, when John Snow took over the reins at the Treasury Department, I remember how he was coming out week after week touting the strong dollar policy. This was clearly B.S. as the dollar has done nothing but fall ever since. Now Bernanke is coming out week after week touting a strong bond market even as the bond market is getting hammered. Does Bernanke have one or both fingers crossed behind his back?
Weekly chart of $NYSI with 5,3,3 Stochastic that is not showing much momo. Look at the size of previous rally candles when $NYSI was rising by 100 or more ticks in a week. Still, $NYSI is rising and for now that is all that matters.

Chart courtesy of StockCharts.com
GL in the week ahead.
Update December 20th, 2010
P/C Ratio closes at .75 so that could mean some bearishness tomorrow, though I don’t really expect much as light volume favors the upside since prices are so easy to defend and the POMO before xmas, yada, yada, yada.
$VXO closed today at its lowest level since April. Interesting that $VIX, $RVX, and $VXN all rallied late in the day. I still think these have more downside, but time will tell.
$NASI appears to be losing some momentum. It closed up 17ticks on Friday while the $COMPQ gained 5pts. Today $NASI closed up 11ticks while the $COMPQ closed up 6.59pts. Doesn’t mean much at the moment.
I’m watching the transports and the semis, both of which are stalling. $SOX is only 5pts away from tagging important support at its 20MA. If the 20MA should fail to hold, then that could mean a run to the 50MA, which is close to 5% lower than where the $SOX closed out the day.

Chart courtesy of StockCharts.com
Weekend Update, December 18th, 2010
As usual next week will hang on news and the POMO before xmas. POMO free money on Monday of up to $17 billion with up to $13.5 billion more during the rest of the week. This is facilitating insiders, who continue dumping shares into the market at a furious pace. Take a look at insider selling at GPS. News out of the EU as of this morning indicates an unwillingness to go along with bailouts of countries in trouble unless those countries implement austerity programs first. At least that’s the way I’m reading the news. I can’t tell if this news is bullish, bearish, or neutral.
Let me point out that I am not bullish at all going into the last two weeks of the year. I have closed out all long positions and have a small position in TYP. This does not mean that I am convinced the market will pull back this week or next but it does mean, at least to me, that the possibility exists. Mega bullish sentiment has backed off a bit from what it was over the past two weeks but it won’t take much to stoke it up again. The markets were essentially flat last week and any move up will doubtless be chased. Ben can control money but he can’t control psychology and in the stock market greed always turns to fear. It’s just a matter of when.
Bulls vs Bearz
Bullish:
5-Day Arm’s Index now at 4.90, which is neutral.
Cumulative $NYAD, $NAAD, $NYUD, $NAUD all confirming current move.
Zweig Breadth Thrust at 53.54 and rising with plenty of head room left.
4 Week New High/New Low ratio at 72.02 and rising with plenty of head room left.
$NYMO & $NAMO both above their respective zero lines.
$NASI showing pretty good strength.
$SPXA50R back to 80.0%
Bearish:
Tom Drakes 2CS closed the week out at 65.09. It spent most of the week near 60 with a low reading on Monday of 60.31.
$VIX:$VXV, as mentioned Friday, closed at a new low for the year.
$VIX, $RVX, $VXO, $VXN are either at or very near their yearly lows.
$BPSPX at 84 has now spent 6 sessions in the mid-80 area. It can go a little higher and stay at this elevated level for a little longer, but it may not.
ISEE All Equities hit 354 on Thursday which is an all-time high for available data, which goes back to 2006. It also closed above 300 three times this month. Previous pull backs and cooling off periods have come after this index has closed in the 260 area.
$NYHGH & $NAHGH while moving in sync with the markets are far below their highs that were put in during the week of December 6th. Since then they have put in a series of lower highs and lower lows while the markets have been putting in higher highs. Over the past few months, these kinds of negative divergences haven’t impacted the market one bit and so these may be little more than ghosts. But you just never know.
$NYSI is struggling and has been since it bottomed at the first of the month and warns that this latest move up in the broader $NYA is highly suspect.
*******
Since the rally began in September, the only losers have been those who sold or shorted so the probability is that longs are on the right side of the trade and have little to fear. $VIX, etc, are near their yearly lows but there’s nothing in the books that says they can’t go back to where they used to be in 2004 or 2006. For the $VIX that would be down around 10. If over the course of the next week the $VIX should break decisively below 15, then a push down to 10 could be in the works.
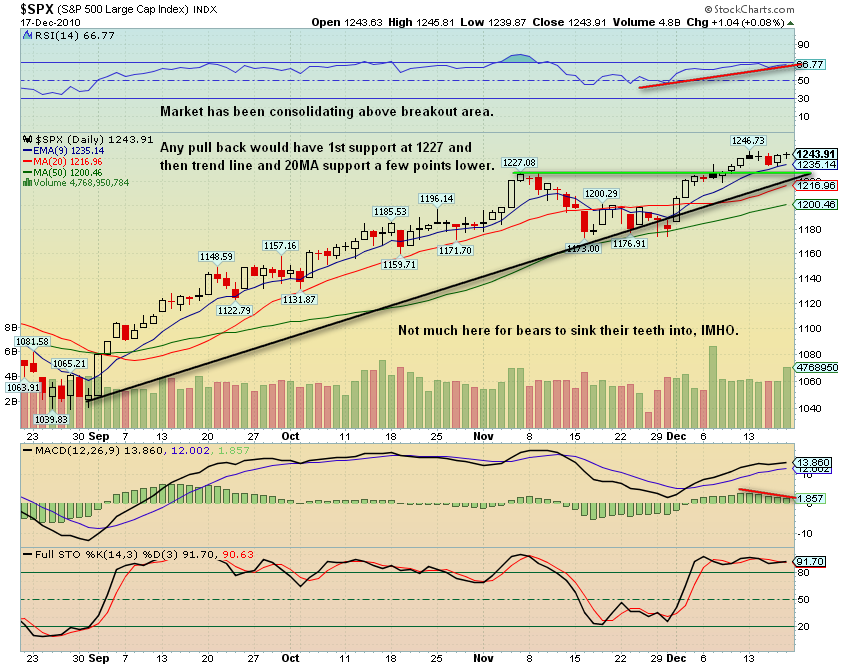
Chart of $SPX showing it to be perhaps too far extended above its 20MA. To get to that 20MA, $SPX would have to first break support in the 1227 double top area.
Click here to open chart in new window.

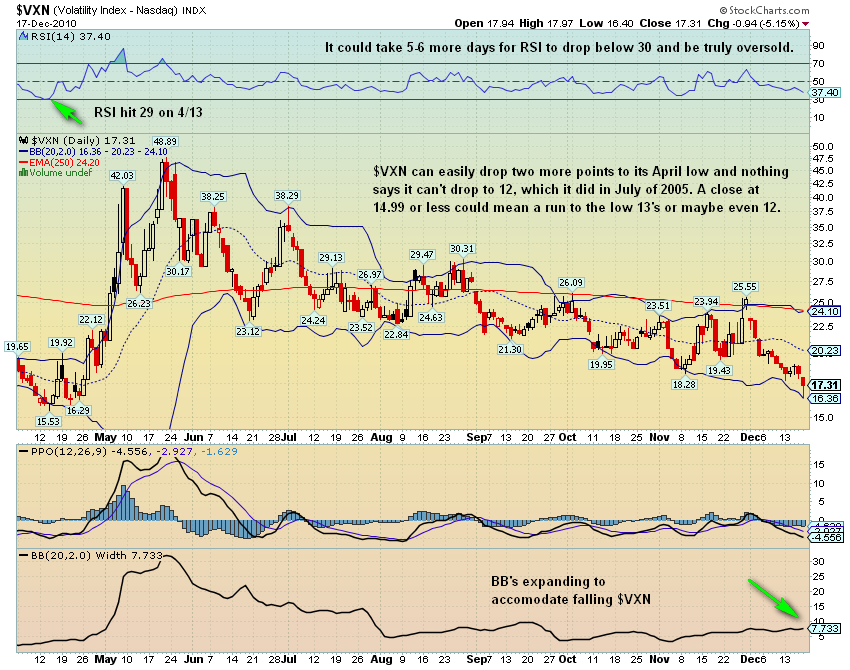
Because $COMPQ is and has been the leader of this rally, I took a look at the $VXN and it appears to me that $VXN has several more points to go on the downside before reaching a point of oversoldness that just about insures a bounce of one degree or another.
Click here to open chart in new window.

Charts courtesy of StockCharts.com
The difference between tulips and stocks is that if tulips lose all of their value you can plant them in your garden and enjoy them each spring.
Good luck in the week ahead.
Quick Friday Update, December 17th 2010
$VIX:$VXV closed today at its lowest point for 2010.
$VIX, $RVX, $VXO all closed near their lowest levels of the year so there is still some potential downside left for these. Plus, it is possible that $VIX could drop down near 10 or 12 before this rally is over. I don’t think it will but this can’t be ruled out.
Some charts to ponder:
$TRIN chart for 2004 through end of 2005.
$TRIN chart for 2005 through 2006.
$TRIN chart 2007 through 2008.
These various $TRIN charts suggest that the markets are getting very near some kind of pull back, but they also suggest that the kind of frothing bullishness we’re seeing can go on for one or two more weeks. This goes along with my thinking about $BPSPX and its ability to stay in the mid-80’s area for about three weeks. $BPSPX has now been in the mid-80 area for six sessions so it has perhaps less than two weeks left at this level, at most, before it finally drops.
We have the ‘greed’ part of this rally going in spades and it makes you wonder if the ‘fear’ part is even in the cards, but while bubbles may come and go human emotions don’t change.
TYP did not close below $24, though it sure appeared that it would. ORCL, RIMM, yada, yada, yada. What will Monday’s encore be like without more ORCL’s or RIMM’s to drive the market? Don’t know.
BTW, I have very few shares of TYP and as anyone who’s been reading this blog for any length of time knows I don’t like to short but prefer to wait and buy the dips. Do not try this at home. If you really feel like you want to short the market via whatever vehicle you choose, why not just do it on paper?
Weekend Update October 10th, 2010
(Added at about 10:45 am, 10/11/10:
With $VIX and $VIX:$VXV gapping down outside lower BB’s at the open, longs need to be extremely cautious here. In the past, this situation has led to market tops with a lag of 3-5 days. However, there is always a chance that today could be it.)
Keltner squeeze. When Bollinger Bands compress to the point where they are inside Keltner channels. This often leads to a dramatic move.
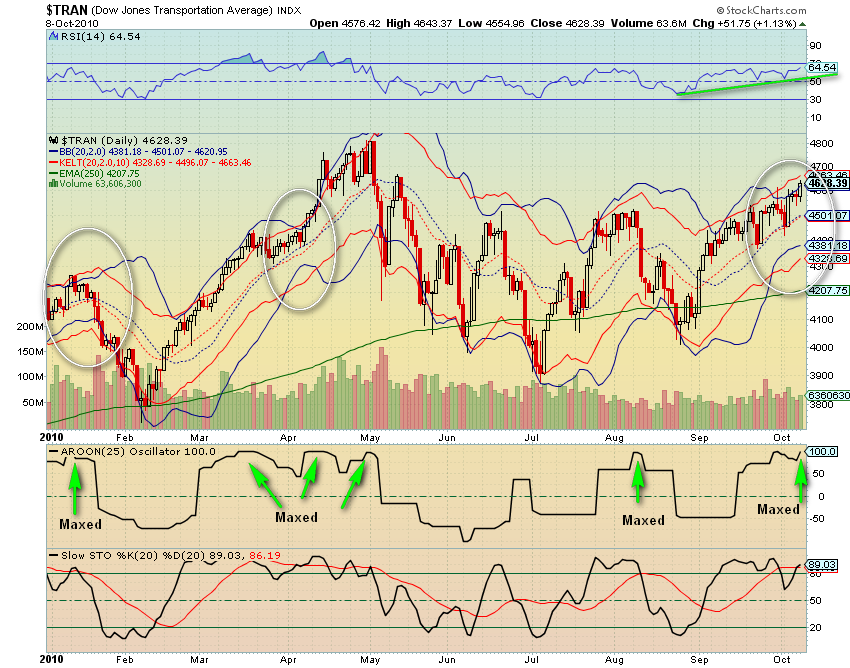
$TRAN, IYR, & XLF are now in the throes of a Keltner squeeze.
$VIX, $RVX, $VXD are also in the throes of a Keltner squeeze.
Which way will these break? Don’t know, but, given the current market environment, it’s easier for me to think that the $VIX will drop 5pts than it is for me to think that $TRAN will break topside and rally several hundred more points. I realize that sounds ambiguous as hell, but $TRAN is already up about 12% from the August lows and was up 2.65% last week. It seems unlikely to me that $TRAN can sustain this move except for the fact that there are no signs of over exuberance in the market now.
Back in early January the transports went into a Keltner squeeze which resulted in the pull back into the February lows. But things were different then. Leading up to the drop, the P/C Ratio was consistently in the .7x area with a couple of readings in the .6x area, 1/8 & 1/9. ISEE All Equities had several readings in the 230’s. $VIX was in a down trend and then on January 11th, $VIX gapped down through its lower BB and closed outside that lower BB. $VIX:$VXV did the same. The long side got too crowded and the market rolled over.
In early April, $TRAN went into another Keltner squeeze then blasted up through its BB, closing above the upper BB for six days. During this time the P/C Ratio was consistently in the .7x area, had a reading of .68 on 4/12, then had an all-time low reading of .56 on 4/14. The ISEE All Equities readings were in the 260’s day after day and then on April 15th the ISEE went to 348, which is an all-time high for the data that is available, which I believe goes back to 2006. (There’s a spreadsheet on the ISEE site that you can down load.) The $VIX and $VIX:$VXV gapped down below their respective lower BB’s and closed below those BB’s on April 12th. The market was just too exuberant, the long side got way too crowded, and the market dropped into the July lows.
Compare those previous times with the current period. The P/C Ratio has been mostly in the .8x area with a reading of 1.07 this past Thursday. ISEE All Equities has been just above 200. $VIX and $VIX:$VXV have only tagged their lower BB’s. Signs of complacency and over exuberance are absent.
$TRAN has been pushing against its upper BB for the last four sessions and finally closed above the upper BB this past Friday. Given the current market environment, it appears more likely that the transports will continue to push the upper BB and may eventually bust all the way through and close way outside.
If you’re bullish, you would want to see $TRAN pull back a little and give the BB’s a chance to expand so that during any subsequent rally $TRAN would have room to move without tagging or busting through the BB’s. If you’re bearish, you would want to see $TRAN gap up and through the BB, close outside the upper BB, and do so for three or more days. In other words, a lackadaisical rise won’t produce the over exuberance and complacency necessary to bring about a significant pullback.
CSX reports earnings Tuesday before the bell. This will be extremely important to watch. If you look at the Railfax site, it’s difficult to tell what’s going on with railroads. There was a spike in activity early in the last quarter but that has leveled off, though activity has not dropped off. This seems to be consistent with last year’s pattern of activity. Ceridian will release their next report this coming week though I can’t find the date yet on their site. While this index isn’t being widely followed yet, it is still key and helpful in gaining insight into over-the-road truck activity.

Chart courtesy of StockCharts.com
XLF is not only in the throes of a Keltner squeeze, it is also coiling in a symmetrical triangle. If XLF can break out topside, then this will help lift the market. If XLF breaks lower, then this could drag the markets down, as well.
Several small, regional banks report earnings on Monday and Tuesday and this could impact KRE. If KRE rises, then XLF ought to rise, as well. If, on the other hand, KRE falls, then that will put pressure on XLF & IWM as the $RUT is loaded with small banks. But on Wednesday morning JPM reports. JPM is the heaviest weighted stock within XLF and their earnings, positive or negative, will most definitely influence XLF.

Chart courtesy of FreeStockCharts.com
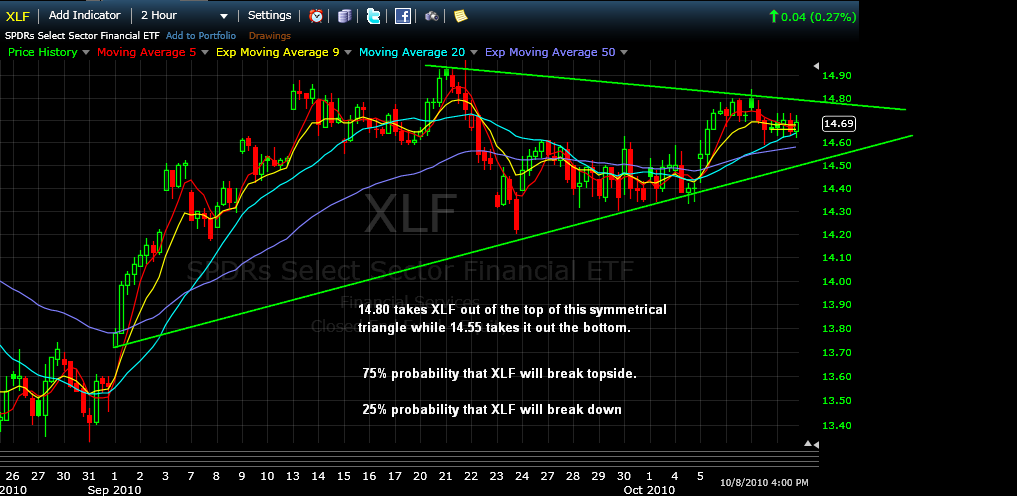
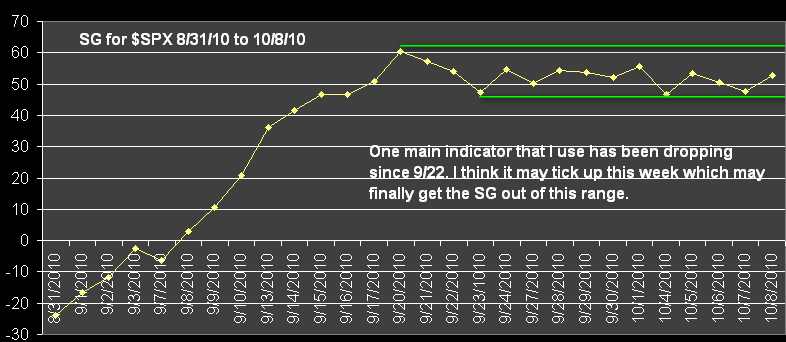
Chart of the SG showing it still stuck in a range. As long as the market doesn’t fall off a cliff sometime in the coming week, then there is a chance that the SG will break up and out of this range.

Regardless of all the bad news out there, Bears are powerless to talk the market down.
Regardless of all the good news out there, Bulls are powerless to talk the market up.
The market will go where the market will go. Our job is to pay close attention, to set aside opinions and beliefs, and go with the market whichever way that might be.
GL in the week ahead.
P.S. I’m very much aware of these very large net short positions held by futures traders in the ES and NQ. I don’t know how this situation is going to resolve but if these commercials started to unload some of their long side contracts the way they did on May 6th, but in a more controlled manner, the market would clearly roll over. But this isn’t happening yet and only the mad men at the helm know if and/or when it will happen. And don’t rule out a huge short squeeze, either. It could be epic. Just be careful.
Paranoia is a higher form of awareness.
Pre-Market Update, September 29th, 2010
Due to scaling, the non-confirmation in the cumulative $NYUD is not as apparent as is the non-confirmation in the CVI. This shouldn’t be close and leave people wondering.

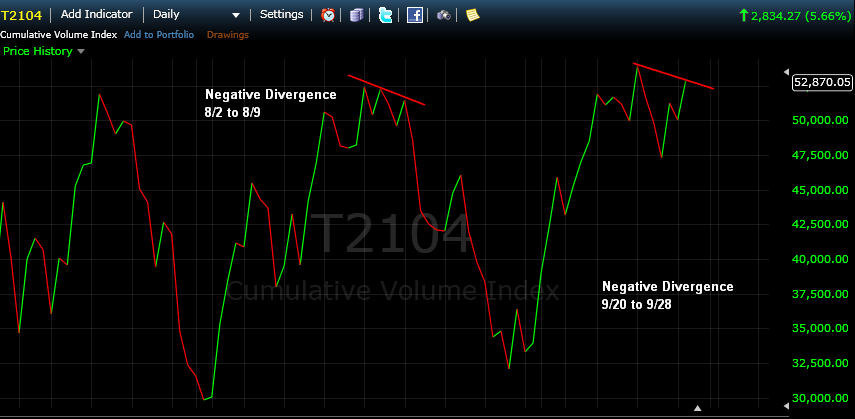
The cumulative $NYAD did not make a new high yesterday. It’s close but it shouldn’t be close. Instead it should have been an obvious new high. Since the $RUT made a new high yesterday, its A/D line should have made a new high as well.

Charts courtesy of FreeStockCharts.com
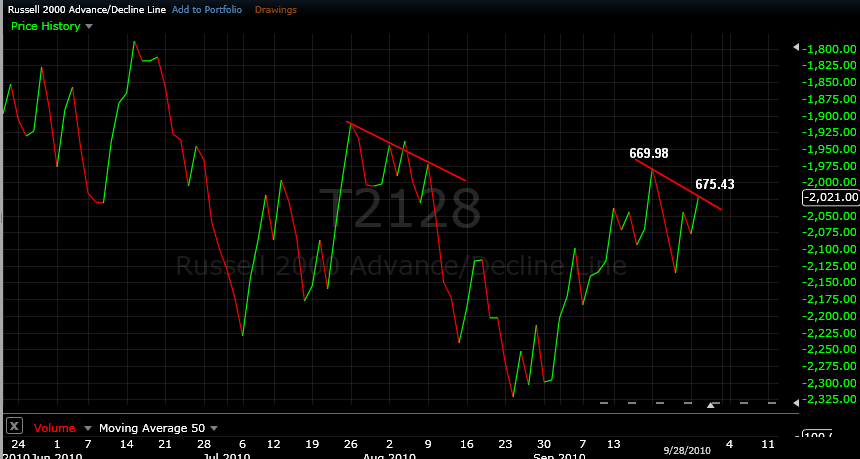
These indicators should not leave people picking through chicken entrails at a high voodoo mass in an attempt to decipher their hidden meanings. Instead, they should be clear, and probably are. Add in the fact that the ADX line for all the majors ticked down yesterday in a signal that upside momentum is waning, and you have a situation that puts longs at high risk. However, and even though the $VIX, $VXN, and $RVX now have Bullish DI X’s, until there is some sign of overt or covert distribution, shorts are front running, IMHO, of course.
GL
Weekend Update September 5th, 2010
14 vs 5
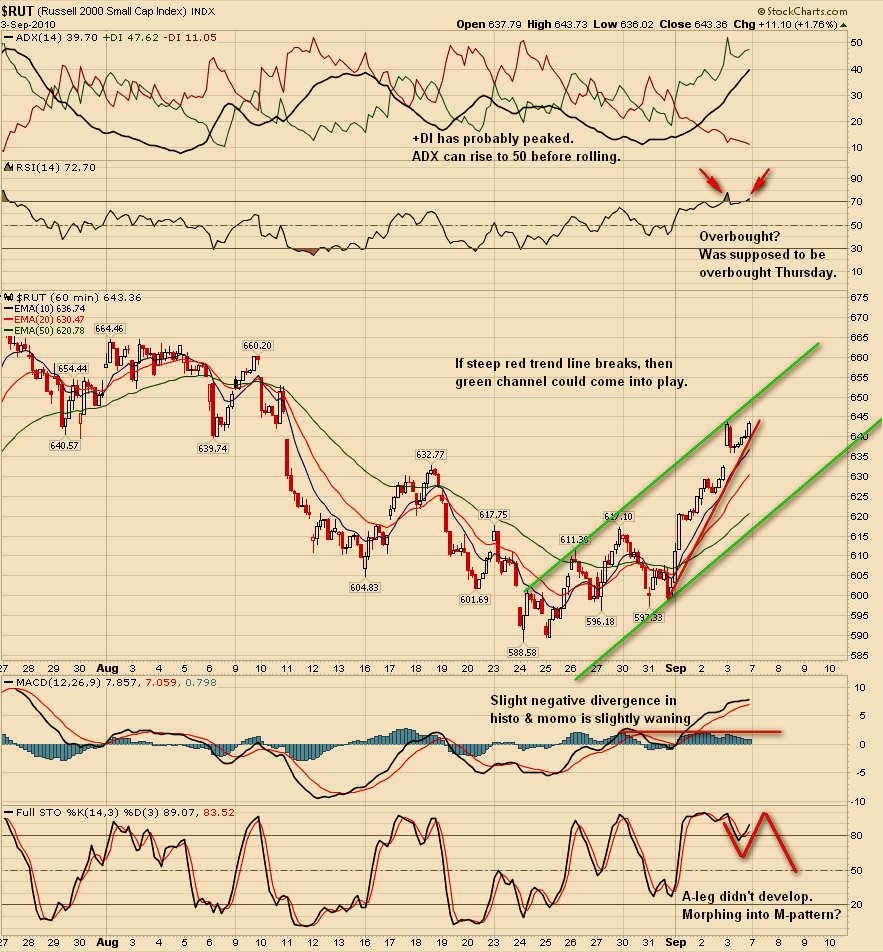
Click here for updated, longer term, $RUT/IWM 60min chart.
I want to point out that while I am ST bearish or cautious I am IT bullish and that there is no way I will short against rising Summation Indexes, $NYSI or $NASI, or a rising SG. The main reason I took profits on Friday is because I chose to play the 3x’s and while the rides up are great, the draw downs not so much. I will be looking for a buying op once the market consolidates or pulls back.
Those three 90% up days in the past six sessions, along with high $TICK and low $TRIN readings, should be a concern for bulls. While the 90% up days are certainly bullish, three clustered so close together hints of buying exhaustion. But that is yet to be determined.
This chart of the $VIX suggests over exuberance and clearly shows a lag time between the $VIX breaking below the lower BB’s and market tops. Based on this chart alone, I see absolutely no reason to hurry in on the short side. Charts of $VXN and $RVX look just like the one below.

All Stock Charts charts courtesy of StockCharts.com
This chart of $SPX is about a bullish as it can get, although a bit extended; however, there are a couple of red flags on the chart. Chaikin Money Flow is not confirming Friday’s mega rally, and $SPX is not alone. This same kind of divergence is apparent for $TRAN, COMPQ, IWM, Q’s, and I’m sure a couple of others. The chart also shows that the faster moving 5,3,3 Stochastic is at extreme levels and this is also true for several other sectors and ETF’s including Q’s, IWM, $CYC, $RIFIN, and IYR.

While the market may be extended, this charts suggests that there is still some upside left, which goes along with the $VIX chart.

This ZBT chart indicates that the market is overbought but suggests that it may take a few days for the market to realize this. Note that when ZBT peaked on 7/26 the $SPX only gained 10pts more before starting its roll. I’ll be watching for a higher high on Tuesday or Wednesday but I don’t know if it will happen.

Chart courtesy of FreeStockCharts.com
If there is a sector that is so overbought it should have a reaction Tuesday, it’s the REIT’s and especially IYR. I will be looking for another DRN buying op once the expected pullback in IYR ends. Of course, IYR could just continue its parabolic move. BTW, that’s not a dragonfly doji, but it is a doji and hints of profit taking and indecision. Google ‘Bearish Doji Star.’

The main reason I’ll be looking to buy dips for now is this chart of $NYSI with ADX. Until this chart and it’s $NASI cousin start to break down, then buying dips is the less risky strategy.

Finally a chart of the SG for the $SPX showing that the SG has broken out of its downtrend and is rising. This indicates that the market is moving up with increasing strength and confirms the current move. As long as the SG keeps moving up then I have to remain bullish as the SG has proven time and time again to be a better trader than me.

In the week ahead, watch your 60min charts. Based on RSI readings over 70 for most indexes and key sectors in the 60min and 15min time frames, the markets are overbought and need a cooling off period in order to digest recent gains. The markets need not pull back to slough off their current overboughtness but can deal with this through time in a sideways consolidation. Be careful trying to front run on the short side and be extra krispy careful trying to short the REIT’s.
IMHO, of course, subject to change at any time.
GL
P.S. While the ECRI data from a couple of weeks back suggested a double dip recession may lie ahead, railroad load data is not currently confirming this, yet. Link to your right and be sure to scroll all the way down to the bottom of the page.
(Adding the following at about 3:00pm ET on September 5th, 2010)
This is what my Lion portfolio looked like at the end of trading on Friday. I don’t think it will go negative between now and the next ‘buy’ signal I get, but I do think that much of these fantasy gains will evaporate in the mean time. In my own accounts, I did not play either FAS or TNA over the past week. I cannot figure out how to link this to the SG Portfolio as it requires a log in for even me to see.

Update August 17th, 2010
At the close:
Hmmm. Never like to see a close like that. Obviously market remains spooked. The way things were going, IWM looked sure to close above $63.01, but noo.
Here’s what happened today, IMHO, of course, and your mileage may vary.
Validation of $NYUPV buy signal.
Validation of $VIX and Bollinger Band buy signal with $VIX closing below the low of 8/11. Same for $VXN & $RVX.
Validation of $NYMO/$NAMO Bollinger Band downside exhaustion signal with $NYMO/$NAMO closing back inside their lower BB’s on 8/16
Partial validation of 60min buy signal with all major indexes and key sector ETF’s closing above their 20MA’s and with several closing above their down trend line. .
Confirmation of positive divergence between $NYHGH and $NYA that formed last Thursday & Friday.
Validation of 5-day Arms Index extreme oversold buy signal when index closed at 11.77 on Wednesday, August 10th, well above the 7.5 trigger level.
I’m about as bearish as I can get due mostly to what’s happening in $NYSI and $NASI. I get the jitters trading opposite these, so, at the very least, I really need to see these stall today. Regardless, I have doubts about the ability of the market to run up to and take out the latest highs and if the markets do take out those highs, I’ll still be a doubter unless those highs are taken out with volume and conviction.
When Ceridian came out with their latest report last week, they showed an increase, MoM, of trucker activity. They use this data to forecast not just GDP but Industrial Production and today’s higher than expected industrial production # would have been no surprise to you. Just sayin’.
Added about 7:30pm ET
Chart comments intended as cautionary, not negative. $NYSI could roll over again before taking out recent highs, just as the market may. However, it is good to see that today’s rally was broad enough to turn the worm. Let’s see if $SPX can take out the 50% retrace of the recent drop which just happens to be the round psycho # of 1100.

Chart courtesy of StockCharts.com
