Archive
Update Black Friday, November 27th, 2009
5:30pm
(Added at 1:20pm, Saturday, November 28th. My apologies. My reference to the COT numbers is incorrect. The latest COT report has been delayed until this coming Monday so the numbers I’m referring to are out dated.)
I wonder how much of this decline was due to a strong $USD rather than news out of Dubai. I fully expected the PPT to come in and rescue the market today given that such a move would have sent a strong message to the rest of the world, but they didn’t show. Or maybe they did which is why the bottom didn’t fall out.
IWM and XLF did a full day’s worth of volume. SPY & IYR did a healthy chunk, considering the short day.
$NYUPV = 22. That’s a climax buy signal. In fact, that’s the lowest reading on $NYUPV in a year
$NYDNV = 631. That’s not enough.
$NYUD = -609. Should be down around -1400.
$NYAD = -2104. That’s a climax buy signal.
Two of the A/D quartet say expect a bounce on Monday, but two others are not oversold enough, yet. I think two is probably enough to initiate some kind of bounce on Monday, but all four would be better. The bounce, should there be one, might be more like the bounce of Nov 2nd rather than the bounce on October 29th. If there is any news over the weekend, positive or negative, concerning Dubai, then have to expect market to move accordingly.
Intra-day P/C ratio hit 1.11 early, which was apparently enough to halt the sell off, among other factors, I’m sure.
$TRIN reading off the charts. Probably not reliable. I have one spike that went from 46 to 82 and then closed at 17. That 17 is more reliable and does indicate panic selling. $TRIN close at 4.49 says panic selling into the close.
$CYC down 2.10% due gold’s big drop and with it FCX, which is about 6.5% of the $CYC. FCX wasn’t alone, of course.
If the market does react to these oversold conditions on Monday, then that’s great if the market can get some traction in the days following such a rally. But with the market more or less rotting from the inside out, it’s going to be tough to sustain a rally for any length of time.
The commercial hedgers remain 60k shares net short the large contract S&P Futures. Maybe they covered a boat load of short contracts today. Maybe they added to their short exposure.
Looks like more dojis for weekly charts of almost everything. IWM & XLF still in sell mode based on those weekly charts.
Summation Indexes for the $NYSE and the $COMPQ had some pretty heavy down ticks today with their McClellan Oscillators dropping deep into bearish territory.
The wild card is going to be the $USD.
Three of the four indicators for the SG’s for the $SPX and the $COMPQ reversed today.
Current status for the SG’s for the $SPX and the $COMPQ:
Unconfirmed, Phase III sell signal.
My preliminary calculation for the SG takes it to -22.9. Wednesday’s reading was -10, which I forgot to put up on Wednesday and which was up from Tuesday’s -15. So that down tick today was very powerful.
This is not the time to try and be a hero. Be careful. Let the dust settle.
8:50pm
Below is the SG chart for the $SPX. It shows a change of direction with a 12 point move south. Based on the movement in the A Indicator, the most sensitive and fastest moving indicator, today’s move is nowhere near a climax move. The $NYUPV and $NYAD may be giving climax signals and since Monday’s seem to be gap up days, those signals may be correct for a one-day bounce, but the SG says that’s about all that can be expected, at least for the moment.
If you really want to see where the big problem is, take a look at $NAA150R over at Stock Charts. Until the deterioration in the Nasdaq, $RUT, and Financials ceases, then you just have to expect more pressure on the markets in general.

Sectors to avoid, November 26, 2009
This was just going to be a long post with a warning about three sectors that were already showing signs of weakness, but then this Dubai news comes out.
I know, based on the hits I get, that there aren’t many of you out there, but I hope you’ve been taking seriously all the bad news I’ve been bringing up lately. Except for a failed TZA trade the other day, I’ve been in and remain in cash. I hope you either hedged or raised cash over the past few sessions.
The following is what I was going to post prior to reading the Dubai news.
Sectors to avoid:
Two key sectors and one minor sector have been flashing warning signs this week. The key sectors are the financials and the small caps. This isn’t anything new. The XLF and the IWM have been setting up in these huge M-A patterns. The M-A pattern would have been negated by IWM if IWM was able to first take out 60.68 and then put in a new rally high, neither of which have happened. Barring govt intervention to avoid a major sell off on Friday, it doesn’t appear the M-A pattern is going to be negated any time soon. These two key sectors have been lagging for quite a while and appear to be rolling over. XLF has now closed below its 20MA on the 60min chart for two days, while IWM has only just done that during Wednesday’s session. I’ve been warning about these two sectors for a while, so no change there.
IYR is the next sector to avoid. It has been flashing warning signs since it peaked on the 16th. It’s chart looks crazy with huge gaps every other day but it continues to close below its 20MA on the 60min chart and its 60min chart reveals a down trend in place. IYR put in a rally high back in September and now just can’t seem to get going. The chart below shows the down trend on the 60min chart.

Not necessarily a sector to avoid, but the $TRAN did not make a new rally high this week. As I said the other day, how hard would it have been to get those extra 6pts? Not hard at all and yet this did not happen. So the $TRAN has been lagging and the $TRAN has been doing a good job of warning when the market was getting ready to pull back. The $BDI is rolling, something it does from time to time, and this may be playing into the little bit of weakness that is evident in the $TRAN. And of course, the airlines and railroads aren’t helping much. I mean, you can pump FDX to the moon but you need more than that.
New margin requirements for the 2x and 3x ETF’s were most likely going to cause some artificial swings in the prices of stocks like QLD and TNA on Friday & Monday as traders liquidate shares in order to meet those new margin levels. With the Dubai news, this is just going to be wild.
So this was going to be the post for today. Add this to Wednesday’s post, scroll down a couple of posts to view the chart of IWM with the M-A traced on it, and you have all you need to be on high alert. This Dubai news has already changed this. The market has been weak this entire rally leg as evidenced by a Summation Index that has failed to get above 500. The pro’s have been building a net short position in the futures while off loading equities to unsuspecting retail longs, and bearishness is near a multi-year low. Enter the Dubai news into an already perfect set up, and you have everything necessary for a significant market drop. I’ve been saying since last week that $SPX 1029 was a possibility and that certainly appears to be in the sights right now.
Oh, and I wouldn’t be rushing out and buying the first dip that comes along. That could prove fatal. Watch the A/D quartet. They’ll flash a ‘climax’ buy signal in the days ahead but there is a chance that the first such signal may just be a head fake. Might still be a money making opportunity but only for those who are fast on their feet.
Update November 25th, 2009
4:45pm
Here is the problem I’m having with the market right now. When the market came off the bottom in March, it moved up with strength which was easy for even us mortals to measure. You had the $BPSPX coming off a major low and rising quickly. The Summation Index had dropped to -1000, a signal of a major bottom, and then started climbing indicating the rally had strength. This was further confirmed by the $SPXA50R, etc. The $VIX was up in the 50’s and had pushed through the upper Bollinger Band, and then the $VIX began to drop. The market moved higher with strength and conviction. It then went into a consolidation period from May through early July, and then rallied hard up to the 2nd week of August. Again, that July rally came with strength and conviction. The same thing happened in September and it happened in October, at least for a while, until signs of weakness started making their way into the market. And now we have this rally off the Nov 2nd low that is devoid of any of the usual signs of strength, conviction, or broad participation. I think we’re currently in a topping process and that the market is getting ready for a pull back. Nothing major. Just another garden variety pull back with a nice buying op sometime in the not too distant future. But what if I’m completely wrong?
If you did not look at a daily chart of the $SPX and if you hadn’t ever looked at a daily or weekly chart of the $SPX but instead you just looked at breadth indicators and based your decisions on those alone, you would have to think that what you were looking at was a bottom in progress and not a top. You would see that the $BPSPX is languishing in the 70’s, that the Summation Index is below 500, and that buyers appear to be on strike but that sellers may have become exhausted. Is it possible that instead of putting in even a short term top that the markets are putting in a base from which to launch the next rally leg? I have no answer but because this is a possibility then it has to be considered.
Also of note is the fact that Bob Prechter is now telling his subscribers to go 200% short the market. This shouldn’t be surprising. I think he’s been calling a top ever since the end of March. At least he’s consistent.
In other news, looks like the SG for the $SPX is going to have a decent uptick today. I don’t know what to think about this as of yet, but if this should continue on Monday, then I will have to change the status on the SG for the $SPX. Two of the indicators have stalled but they have not reversed. They’re making new highs but the increments of increase are insignificant.
The SG for the $COMPQ is more or less in the same boat. One key indicator reversed today while two of the others are making insignificant new highs.
Current status for the SG’s for the $SPX and the $COMPQ:
Entering transitional phase.
Maybe they’re going to transition back up. Just have to see.
$RUT and XLF underperformed the general market today so I wonder if they’re getting ready to head back south. IYR only up 3cents so no help there, either.
And they absolutely destroyed the $USD today.
I’ll see if I can’t put up a chart later for the SG on the $SPX.
7:00pm
Take a look at this. Just more fuel on the fire.
Update November 24th, 2009
5:50pm
The $TRAN, the $CYC and XLF were the worst performers today with the $NDX and $RUT closing in from behind. It’s the $TRAN, though, that’s going to lead the way. Gets weaker, market gets weaker. Gets stronger, market gets stronger. $TRAN closed just below the 9EMA. Doesn’t mean much now but could in the days ahead if the $TRAN can’t right itself. $TRAN and $CYC could be getting ready to set up an ABC down structure if they close below last Friday’s low in the next couple of sessions.
Weakness in the $CYC due in part to HPQ.
$BDI is rolling over.
It looks to me that the lower BB’s on the $VIX daily chart might start to move up tomorrow. Those BB’s won’t become a factor for a few more days, I don’t think.
The A/D quartet aren’t giving any clues.
$NYA50R, $SPX50R, & $NAA50R all moved lower today. If the market had any real underlying strength and breadth to it, I don’t think they would have done that on an essentially flat day, but what the hell do I know?
The Summation Indexes for the $NYSE and the $COMPQ moved lower today. And the McClellan Oscillators for both have now moved back below the zero line indicating that buyers are leaving the building.
The SG for the $SPX had a lower reading today. I did the math wrong yesterday and said the SG had a reading of -17 when in fact it had a reading of -15. Sorry. Not a big deal because it’s the direction that counts. And today the SG reversed. I’ll do the math later this eventing to make sure I get it right and will post it then. Two of the indicators went backwards today and the B momentum indicator stalled.
Therefore, the SG goes from a transitional phase to:
Weak, unconfirmed, Phase II, sell signal.
Emphasis on weak. As you know by now, when this thing starts to change directions it just doesn’t go straight down. It will meander for a day or two. Almost any kind of rally tomorrow will cause it to move up but, based on all the other issues in the market right now, I think that the die is cast for the next few days.
At about 2:00pm, the $USD started dropping which is the exact same time the markets had that little rally that lasted for an hour or so. Just sayin’.
9:30pm
The SG reading this evening is -18, so a reversal there. I’m still expecting some kind of pull back to develop, though obviously my timing isn’t that good, and I still think that $SPX 1029 is a possibility. Pre-holiday low volume action generally favors the upside. Also, the market needs to confirm the SG with some kind of downward move in the next few days. Until then, anything can happen.
I noticed on Cobra’s page over at Stock Charts, that he uses a ratio with $NYDNV:$NYUPV. On his site he says that a reading greater than 35 means a market bottom. I’ve done a little checking with this ratio and I’m not quite seeing it, but maybe you can.
With the Summation Index still below 500 and now dropping a little, one has to be extremely careful at this juncture. The pro’s can push the market higher if they want, just as they’ve been doing all month, and they know ten times better than me that buyers are not as excited about the market now as they were back in July or October. Those pro’s will be happy to off load shares to you at current levels, if only you’d just step up to the plate with an offer. Then they’ll either short the market with your money or sit on that money until issues get re-priced to attractive levels.
Just be careful. If things continue to deteriorate covertly then they’ll doubtless deteriorate overtly soon enough.
Oh, and was today’s big drop a reaction to yesterday’s extremely overbought $TRIN? Hard to say.
$NYUPV
$NYDNV
$NYUD
$NYAD
Pre-Market Update, November 24th, 2009
9:15am
I didn’t update the SG’s yesterday but there is no change. They are both in a transitional phase. This is a pure judgment call on my part because yesterday all four indicators did tick up and the SG for the $SPX did move much closer to the zero line. The reason for this is that there is quite a loss of momentum evident in two indicators on the $SPX. Only a mega rally today would correct this. I am second guessing the SG and as I’m learning through following it, this is not a good idea. The SG began to lose downside momentum on 11/4 and then on 11/5 the momentum indicator reversed. If I had entered the market then, when the SPY closed at $106.85, I’d be sitting on about a $4 dollar profit right now. I’d still be in the SPY today and waiting for a real reversal signal from the SG. In other words, the SG is a better trader than I am. Because of this, on the next dip buying opportunity, I’m going to set up an ideal portfolio to track the SG.
But as I’ve been going on about for the last several days, the market is not exhibiting internal strength. I found this article last night about the Summation Index in which Tom McClellan says that if the bulls are in charge then the the Summation Index should be above 500. The Summation Index hasn’t been above 500 since 11/3 and it just can’t seem to make up its mind about whether it wants to go up or down. Maybe that will all change today.
Update November 23rd, 2009
4:30pm
I did dump TZA today for various reasons.
1.) Monday’s lately have been green. Should have thought of this last week.
2.) Thanksgiving week with a positive bias.
3.) HPQ’s earnings.
4.) Possible sign of strength today based on market breadth, etc.
5.) It remains reckless to try to play the short side, which is why I only had a few shares of TZA. I would have added more if things set up correctly.
Then there’s this. Note the time. I have found that the market maker for IWM will often push prices through those large order blocks which in this case start 59.62 and run to 59.71. After all, that’s how he/she/it makes money. The MM will do everything possible to turnover large blocks of shares. In this case, the MM couldn’t quite get things going on the upside, so the MM turned around and headed south, but the MM didn’t forget about all those shares up in the 59.6x area and finally pumped the market back up in the last couple of minutes of the day to 59.67. So I saw all those blocks earlier and figured the MM would try to turn them over so that is when I decided it was time to unload TZA. Anyway, the next time you think one of those late day pumps is coming, check Level II. If you see a bunch of large blocks of shares stacked up, then you just have to figure the MM will gun for them before the close.

5:45pm
The SG for the $SPX now has a reading of -17 and all should be well, right? Maybe. The problem is that two of the indicators are starting to roll. They will roll tomorrow unless there is another big rally day. Period.
I started having trouble with the SG during the latter part of October when the market kept going on and on but the SG just never got going at all. It stalled and flat lined and it wasn’t that difficult to see that the weakness the SG was picking up would someday come home to roost. And it did. But this little rally leg off the Nov 2nd lows is just throwing curve balls in every direction. During this leg, there has only been one day that you could say showed some strength. That was on the 16th. Other than that the SG has been picking up on mediocre performances by the $SPX. It sure looks good but I just don’t know. If tomorrow the B Indicator does in fact roll over and if the D Indicator does in fact do the same, then that will pretty much put a cap on this rally leg.
On a positive note, the $NYA50R, $NAA50R, & $SPXA50R all ticked up today, which shouldn’t be surprising. The readings still aren’t showing much participation. They are acting more the way they act at bottoms than at tops. So, is this a bottom or is this a top, because if this is a bottom then we’re going ballistic.

The $TRIN dropped to .14 at the open today. That is the lowest reading I’ve seen on that in so long I don’t remember when. The $TRIN then stayed below .39 for the first 30mins of trading and that usually means some kind of pull back in the next session. The last time the $TRIN got down in the .3x area was last Monday, the 16th. Not much happened on Tuesday as a result. The P/C ratio never got above .66 today and then closed at .67. Lots of complacency there. The $VIX is still way above its lower BB, and the Summation Indexes and the McClellan Oscillators turned up today. I’m not going to even try to guess what any of this means. All I do know is that the $USD was trashed today and if this continues then the markets will most likely head higher.
Weekend Update, November 21st, 2009
As I have said for the past couple of days, I’m expecting a pull back to develop over the next few sessions. I don’t think this is going to be the end of the world. I do think there is a very good chance that the $SPX could revisit the 1029 area from the November 2nd low, especially in light of the fact that the 20MA on the weekly chart is right now at 1029, but I reserve the right to change my view as market dynamics change.
The market has been very predictable since the August peak. It pulls back starting around the 20th of the month, takes back 50% to 70% of recent gains, then bottoms around the first of the next month, only to rally all over again. But as Pee Wee Herman said, “First your mind plays tricks on you, and then you play tricks back.” Or, maybe it will be different this time. Instead of a pull back that draws near the previous low, maybe this pull back will take out the low and keep on going. And of course, the market need not pull back any further. It could rally from current levels. Except that it is a little different this time.
This chart of the $NYA50R clearly shows a lack of participation with the latest market peak accomplished with 68% of stocks within the $NYA being above their 50MA’s. This is the kind of behavior you expect to see near market bottoms but not in an index that is just four days removed from a new rally high. It clearly shows weakness within the index. Compare the current 68% reading to the May, August, September, and October peaks where at least 84% of stocks were above their 50MA’s indicating broad based interest and buying. This chart looks more like the late June peak that led to the July lows. And that’s what I think we’re going to see.
And if you really want to be bothered, take a look at the $NAA50R.
This rally off the March lows has been broad based. It has been led by Big tech, small caps, transports, the cyclicals, & financials, and as the tide rose, the rally lifted all the other ships. But we now have trouble in two key sectors, the small caps and financials.
The $RUT, $BKX, & XLF all gave ‘sell’ signals on their weekly charts in late October, based on the full stochastic dropping below 80 and a bearish cross on the MACD, along with RSI 14’s that have peaked. Despite the action over the past two weeks, these sell signals persist. While the rest of the key sectors put in or nearly put in new rally highs in the last week, neither the small caps nor the financials did. This sets up an ABC down structure in the $RUT and XLF, etc. The same could be said for the $SOX, but it’s just not a leading sector anymore. Look at the chart of the daily IWM a couple of posts below this one for a hypothetical trajectory for IWM.
Adding fuel to the pull back theory are the weekly charts of the $NYA, $SPX, $INDU, $RUT, and IYR, which all have shooting star dojis, or at least the potential that the weekly doji is in fact a shooting star. You can clearly see on the $NYA chart below what has happened in the recent past when these shooting stars appeared. Also note that the PPO has a bearish cross, the full stochastic is below 80, and that the RSI 14 has broken its longer term trend line and that it is rolling over now and headed for the shorter term trend line.
So you’re thinking, “A pull back to $SPX 1029? Wow! What a buying opportunity.” But what if it’s different this time?
Those commercial futures hedgers are still net short 60k contracts. They took on 3900 new long contracts while adding 2500 new short contracts as of November 17th. They’ve gone from about 50k net short a few weeks back to 62K net short last week, to this week’s 60k net short position. Clearly they don’t think the worst is behind us. And neither do mutual fund investors.
Mutual fund investors are fleeing equity based mutual funds and flocking to bond-based mutual funds in record numbers. According to this article from Morningstar, the exodus began in earnest during the month of September and most likely continues to this day. Mutual fund investors who went through the trauma of a 401K meltdown regardless of whether they stayed in the market or not apparently have little appetite for any more risk. They would rather invest in a safe though low yielding bond-type fund rather than invest in an S&P Index fund. And who can blame them since many are baby boomers nearing retirement? They probably didn’t sleep well during the market meltdown and they’re simply not going to risk their retirements again. But their monthly contributions are much needed if the market is going to go higher or at least go higher and stay up there. If this exodus is continuing and if it continues, then end of the month window dressing by mutual fund managers just won’t be the same.
Which brings me to the $TRAN. During this week’s rally, the $TRAN failed to make a new rally high while all of the other majors, the $SPX, $NYA, $COMPQ, & the $NDX, did. The $TRAN only missed a new high by about 6pts, but how hard would it have been to get that? This is the first time in quite a while that the $TRAN did not lead the pack to a new high. Maybe this doesn’t mean much right now but we’ve had divergences in the financials, the small caps, and the semis and you just have to wonder if the $TRAN might be moving into that camp.
Finally, or until I think of something else, there’s the $CYC. The Cyclicals Index has been this rally’s poster child. Up 192% from the March low. The stocks within the Cyclicals Index represent a cross section of U.S. manufacturing, finance, transportation, technology, chemicals, etc. These guys are the core of the economy, have been pumped to the moon, and they need to be watched closely. If profit taking takes place in these core stocks, then the decline that I’m expecting could go a bit deeper than even I’m expecting.
So the SG’s are giving mixed signals and have entered a transitional phase. The markets appear stretched with fewer and fewer stocks participating. The Summation Indexes have rolled over, not something you want to see considering they just turned up a few days back, and the McClellan Oscillators are below the zero line and are pointed straight down. The VIX is still quite a ways above it’s lower BB and the A/D quartet, $NYUPV, $NYDNV, $NYUD, & $NYAd, are in flux. This is no time, IMHO, to be adding to long positions, and shorting this freight train is dangerous. If I was one of the lucky people who bought in March, I wouldn’t be too worried unless $SPX 1029 is taken out with gusto. Otherwise, this is just a re-pricing pull back and buying opportunity in progress.
Keep an eye on the $USD. There certainly does appear to be a correlation between dollar strength or weakness and the market.
Have a good weekend.
Update November 20th, 2009
7:10pm
The SG for the $SPX had a slight uptick today. It went from -30 to -27. Yesterday momentum slowed in the B Indicator. Today momentum in the B Indicator stalled. Only a substantial rally on Monday will prevent the B Indicator from reversing. The same thing is happening with the SG for the $COMPQ.
Therefore, the current status for the SG’s for the $SPX and the $COMPQ remains:
Entering transitional phase.
I will have more a little later or over the weekend, but without some kind of major rally in the first couple of days next week, then I still expect the market to continue to roll and maybe take out the lows from November 2nd. I may have to eat those words because the market can go back up on the same kind of breadth that it went up on in the first place. Time will tell.
According to the $NAA50R, only 35% of Nasdaq stocks are above their 50MA’s. That’s not the kind of internal strength you expect to see near market tops. Of course, I could have this all wrong. Maybe the market is actually bottoming right here. I don’t buy it, but you never know.
I did pick up some TZA today. Small position just in case I’m completely wrong.
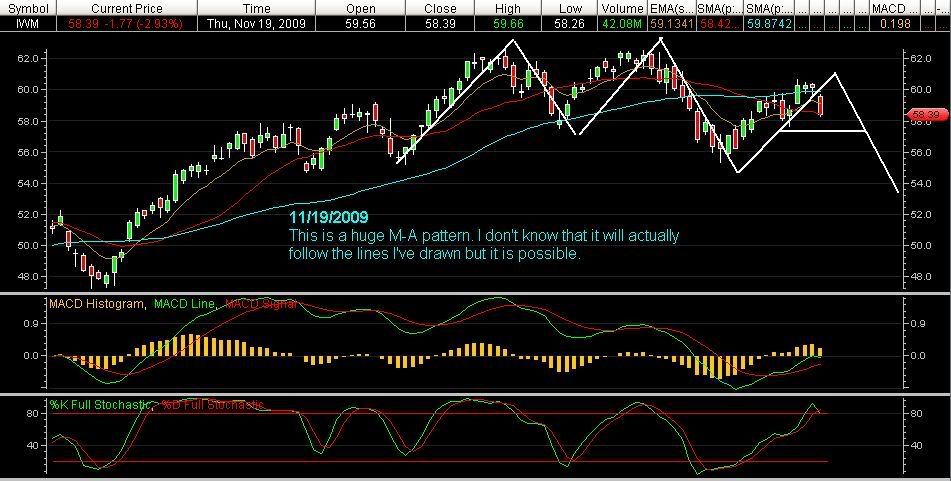
Update November 19th, 2009
4:20pm
I’ll be back later with more stuff, but in the meantime, here is a chart of IWM showing an M-A pattern. This is pure speculation on my part. IWM could rebound tomorrow and climb back over the peak of 60.68, which would negate this pattern. Until then, this pattern may offer some insight into where IWM is going.
This same pattern can be seen on the $SOX and not as clearly on XLF & $RIFIN.

_______________________________________________________
6:40pm
The SG for the $SPX dropped from yesterday’s -28 reading to -30 today. The B Indicator is showing a considerable loss of momentum.
Current status for the SG’s for the $SPX & $COMPQ:
Entering transitional phase.
I’ve been questioning this entire rally due to the lack of participation as evidenced in the $SPXA50R, $NAA50R, & $NYA50R so I think the SG’s and the markets have peaked for now. Yesterday the $TRAN and FDX gave a heads up and today they sold AAPL, destroyed INTC & $SOX, and now they’ve taken DELL to the woodshed.
The $SPX hasn’t taken out a major swing low since the June decline. Because this rally just never had much substance, I think the $SPX may have to visit 1029 before it can move higher. I know that would make those futures traders happy.
$NYUPV, $NYDNV, $NYUD, & $NYAD are oversold to the point that there could be some kind of a bounce tomorrow, but they are not so oversold that the bounce, should it happen, will amount to much, especially since it will most likely be sold into heavily. I do find it interesting that these gauges gave a sell signal on the 9th when the $SPX was at 1093. I wasn’t sure at the time if that sell signal would be meaningful or not and I’m still not sure, but I do find it interesting especially considering where the $SPX closed today.
The Summation Indexes have rolled over and the McClellan Oscillators are below the zero line. The Summation Indexes never really did get going during this rally phase, another reason I think we could see $SPX 1029 again.
Update November 18th, 2009
6:50pm
The reading in the SG of the $SPX is -28 today. Yesterday it was -34 so it is drawing closer and closer to the zero line. But that’s not the whole story. The C Indicator showed a slight loss of momentum today. The others look fine.
Current status for the SG for the $SPX:
Moderating, partially confirmed, Phase IV, buy/hold signal.
Current status for the SG for the $COMPQ:
Moderating, partially confirmed, Phase IV, buy/hold signal.
IYR made a very nice recovery today, but did so on light volume. Today’s move will need to be confirmed tomorrow…with volume. I don’t like the sector but I do watch it.
Today’s big story is the $TRAN. The transports came down just a little today but did so on a little bit heavier volume. The transports have been very good over the past several months at starting pull backs a couple of days ahead of the general market. The small drop in the transports today might not lead to anything, but it’s going to be important to watch them closely over the next few days. FDX came down hard but the volume wasn’t there. The airlines, AMR, CAL, LUV were also down pretty hard. The sector doesn’t look that weak, but it could tomorrow or Friday.
And wouldn’t you know it. THEY took IWM above 60 in the last 15min of the day. I just knew they wouldn’t let IWM close below 60, but I don’t know that it means a whole lot at this point.
What’s bothering me again today are $NYA50R, $SPXA50R, & $NAA50R. These are all trying to roll over from already low levels. 42% of $COMPQ stocks are below their 50MA’s. This is not healthy. Even on a less than 1/2% pull back day like today, the $NAA50R should not have dropped, but it did. This is a symptom of internal weakness. And it’s the same in the other indexes. Fewer and fewer stocks are participating.
Yesterday and today, advancers fell behind decliners in the $NYSE 12:17. I can understand today, but yesterday the markets closed green. The Summation Indexes for the $NYSE and the $COMPQ are still moving up but the McClellan Oscillators for each are now pointing straight down. The $VIX seems to be dropping like a rock and the P/C ratio at .84 says that complacency reigns. Maybe everything will resolve tomorrow with a broad based rally on good volume. Maybe not. And don’t forget that lurking out there somewhere is a huge net short position in the S&P futures. When are those guys going to make a move?
And when was the last time you saw the $NDX at the head of a southbound train?
Just be careful right now.
Adding the following at about 7:10pm
Look at the histogram on the $NDX and the $TRAN. You can see the same thing, though not as pronounced, in several other key indexes.
