Archive
Update March 1st, 2010
These major indexes and/or key sectors got Aroon Bullish Crosses today. In the case of $TRAN, IWM and a couple of others, these crosses happened at or near the open.
$TRAN
IWM
All of the financial sector ETF’s and Indexes that I follow, including $BKX, XLF & $RIFIN.
$SOX
$INDU
$SPX
$CYC
$COMPQ
IYR
QQQQ but not the $NDX
$NYA potential Aroon Bullish Cross with a break above 7109.
The ABC down structure on the $SPX is now invalidated with a break above and especially a close above 1112.29.
Chart of Transports shows a topping wick on today’s candle suggesting a pause in tomorrow’s session, but this important leader is moving up with good momentum. All that is needed now to keep that momentum going is for the ADX line to turn up.

Chart courtesy of StockCharts.com
The candle that burns twice as bright lasts half as long.
$SPX = 41.81
$COMPQ = 45.98
The spreadsheet has been updated.
You can see from looking at the spreadsheet, link to your right, that both SG’s are adding digits at a good clip right now. The number of digits added or lost is how strength or weakness is determined. For the moment, the SG’s are building strength in a way not seen since the July rally. This is evidence that the rally is real and that the least risky trade for now is on the long side. This is not a recommendation to buy or sell any stock, ETF, or mutual fund. Do your own due diligence.
RTH made another new rally high today.
Update December 15th, 2009
6:10pm
I’m seeing a slight loss of momentum, especially in the $COMPQ, but the SG’s still moved up today. I’ll put up a chart later. (Chart at bottom of post.)
$SPX 1100 holds and longs don’t need to worry, too much, and bears need to worry a bunch. Below $SPX 1100 and then maybe we’ll get this long over due pull back. Today’s action needs follow-through to be meaningful, IMHO.
The BB’s have contained this move so far, though it’s questionable on the $CYC. Volume came in today. Might not mean anything.
All I can see right now is that $SPX, $INDU, and $NDX got too overbought on their 60min charts yesterday, and then IWM got too overbought today so these are, for the moment, just working off some of that.
$USD rallied hard. Was that why the market pulled back or were the markets just overbought?
$BDI continues to roll.
P/C ratio at .76 so no one is worried too much.
XLF, $BKX, FAS, KIE with Aroon sell signals today on the daily’s. That’s not easy to do. $HGX and XHB got one of those last week. Probably others.
Summation Index getting further away from 500, though the McClellan is pointing straight down.
Alex Roslin was certainly correct about being bearish on banks, and the guy over at emini-watch has some interesting facts about the current net short position held by the commercials.
SG’s more or less flat today. Also notice the short distance between yesterday’s and today’s points, and the distance between Monday’s and Friday’s points. It’s the distance that indicates the power or lack of power in a move. So today’s SG’s are saying not much power in today’s move.

Weekend Update, November 21st, 2009
As I have said for the past couple of days, I’m expecting a pull back to develop over the next few sessions. I don’t think this is going to be the end of the world. I do think there is a very good chance that the $SPX could revisit the 1029 area from the November 2nd low, especially in light of the fact that the 20MA on the weekly chart is right now at 1029, but I reserve the right to change my view as market dynamics change.
The market has been very predictable since the August peak. It pulls back starting around the 20th of the month, takes back 50% to 70% of recent gains, then bottoms around the first of the next month, only to rally all over again. But as Pee Wee Herman said, “First your mind plays tricks on you, and then you play tricks back.” Or, maybe it will be different this time. Instead of a pull back that draws near the previous low, maybe this pull back will take out the low and keep on going. And of course, the market need not pull back any further. It could rally from current levels. Except that it is a little different this time.
This chart of the $NYA50R clearly shows a lack of participation with the latest market peak accomplished with 68% of stocks within the $NYA being above their 50MA’s. This is the kind of behavior you expect to see near market bottoms but not in an index that is just four days removed from a new rally high. It clearly shows weakness within the index. Compare the current 68% reading to the May, August, September, and October peaks where at least 84% of stocks were above their 50MA’s indicating broad based interest and buying. This chart looks more like the late June peak that led to the July lows. And that’s what I think we’re going to see.
And if you really want to be bothered, take a look at the $NAA50R.
This rally off the March lows has been broad based. It has been led by Big tech, small caps, transports, the cyclicals, & financials, and as the tide rose, the rally lifted all the other ships. But we now have trouble in two key sectors, the small caps and financials.
The $RUT, $BKX, & XLF all gave ‘sell’ signals on their weekly charts in late October, based on the full stochastic dropping below 80 and a bearish cross on the MACD, along with RSI 14’s that have peaked. Despite the action over the past two weeks, these sell signals persist. While the rest of the key sectors put in or nearly put in new rally highs in the last week, neither the small caps nor the financials did. This sets up an ABC down structure in the $RUT and XLF, etc. The same could be said for the $SOX, but it’s just not a leading sector anymore. Look at the chart of the daily IWM a couple of posts below this one for a hypothetical trajectory for IWM.
Adding fuel to the pull back theory are the weekly charts of the $NYA, $SPX, $INDU, $RUT, and IYR, which all have shooting star dojis, or at least the potential that the weekly doji is in fact a shooting star. You can clearly see on the $NYA chart below what has happened in the recent past when these shooting stars appeared. Also note that the PPO has a bearish cross, the full stochastic is below 80, and that the RSI 14 has broken its longer term trend line and that it is rolling over now and headed for the shorter term trend line.
So you’re thinking, “A pull back to $SPX 1029? Wow! What a buying opportunity.” But what if it’s different this time?
Those commercial futures hedgers are still net short 60k contracts. They took on 3900 new long contracts while adding 2500 new short contracts as of November 17th. They’ve gone from about 50k net short a few weeks back to 62K net short last week, to this week’s 60k net short position. Clearly they don’t think the worst is behind us. And neither do mutual fund investors.
Mutual fund investors are fleeing equity based mutual funds and flocking to bond-based mutual funds in record numbers. According to this article from Morningstar, the exodus began in earnest during the month of September and most likely continues to this day. Mutual fund investors who went through the trauma of a 401K meltdown regardless of whether they stayed in the market or not apparently have little appetite for any more risk. They would rather invest in a safe though low yielding bond-type fund rather than invest in an S&P Index fund. And who can blame them since many are baby boomers nearing retirement? They probably didn’t sleep well during the market meltdown and they’re simply not going to risk their retirements again. But their monthly contributions are much needed if the market is going to go higher or at least go higher and stay up there. If this exodus is continuing and if it continues, then end of the month window dressing by mutual fund managers just won’t be the same.
Which brings me to the $TRAN. During this week’s rally, the $TRAN failed to make a new rally high while all of the other majors, the $SPX, $NYA, $COMPQ, & the $NDX, did. The $TRAN only missed a new high by about 6pts, but how hard would it have been to get that? This is the first time in quite a while that the $TRAN did not lead the pack to a new high. Maybe this doesn’t mean much right now but we’ve had divergences in the financials, the small caps, and the semis and you just have to wonder if the $TRAN might be moving into that camp.
Finally, or until I think of something else, there’s the $CYC. The Cyclicals Index has been this rally’s poster child. Up 192% from the March low. The stocks within the Cyclicals Index represent a cross section of U.S. manufacturing, finance, transportation, technology, chemicals, etc. These guys are the core of the economy, have been pumped to the moon, and they need to be watched closely. If profit taking takes place in these core stocks, then the decline that I’m expecting could go a bit deeper than even I’m expecting.
So the SG’s are giving mixed signals and have entered a transitional phase. The markets appear stretched with fewer and fewer stocks participating. The Summation Indexes have rolled over, not something you want to see considering they just turned up a few days back, and the McClellan Oscillators are below the zero line and are pointed straight down. The VIX is still quite a ways above it’s lower BB and the A/D quartet, $NYUPV, $NYDNV, $NYUD, & $NYAd, are in flux. This is no time, IMHO, to be adding to long positions, and shorting this freight train is dangerous. If I was one of the lucky people who bought in March, I wouldn’t be too worried unless $SPX 1029 is taken out with gusto. Otherwise, this is just a re-pricing pull back and buying opportunity in progress.
Keep an eye on the $USD. There certainly does appear to be a correlation between dollar strength or weakness and the market.
Have a good weekend.
Weekend Damage Report, Nov. 1st, 2009
(Adding this about 2hrs later. Well, I could have saved myself a lot of work if I had first watched Oscar’s video over at youtube. Here’s the link. Look for the video for 10/31/2009 if it doesn’t come right up.)
First the good news. The retail sector is holding up well. See XRT.
Now the not so good news.
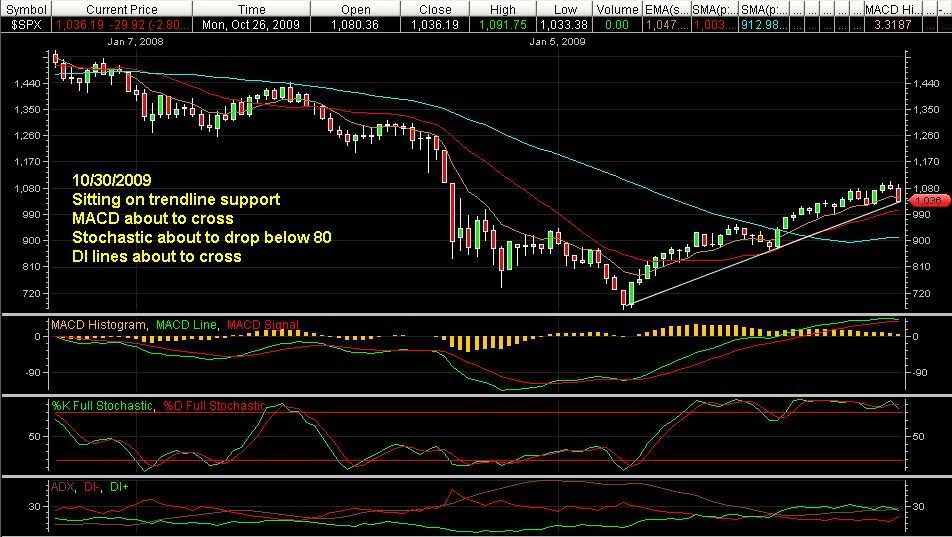
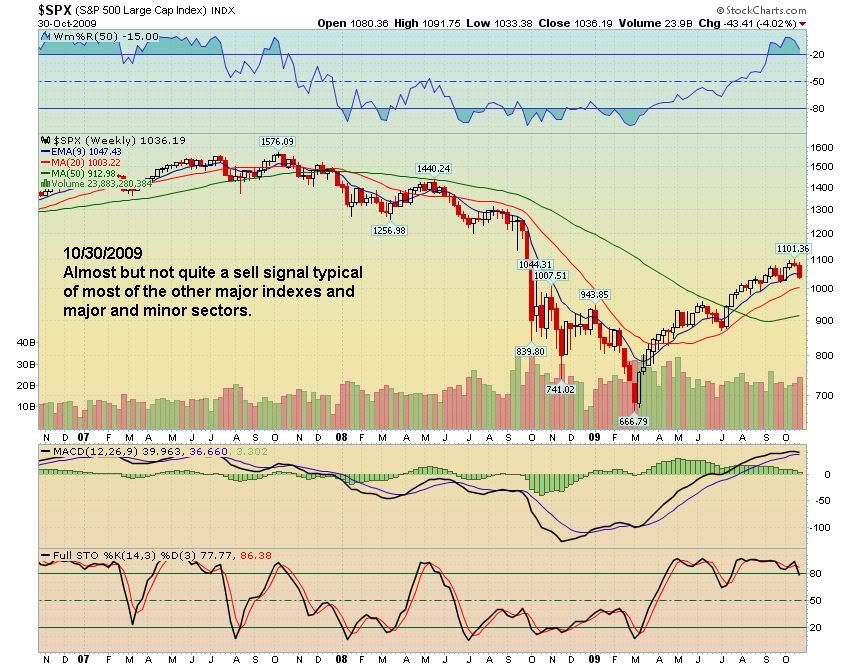
For many of the key indexes, the glass is half full. Using weekly charts, indexes like the $COMPQ & $SPX appear to be under pressure but they have not yet given a sell signal. They are close and the slightest little push in the coming week will send them into the abyss, but they could bounce back. The criteria I’m using to determine whether or not an index has or has not given a ‘sell’ signal on the weekly chart is that the index in question is holding trend line support and that there are no bearish confirmations from the MACD, full stochastic, and the Williams%R (50). This chart of the $SPX is typical of so many of the other major indexes and major sectors. The trend line could hold, the MACD need not have a bearish cross, the DI lines could separate, etc. This chart shows a slightly different picture. For this chart the main difference is that I’m using a Williams%R set at 50. Focus on times in the past when the Williams 50 on the weekly chart has dropped below -20 and especially the declines that follow. But we’re not there yet. The charts for most of the major indexes look about the same as the two charts above and so the markets could go either way. A push higher next week, and we’re off to the races again. A push lower next week, and the trend lines will break and each of the four indicators will have bearish confirmations.
This list includes many of the major indexes and sectors that are in the same situation as the $SPX. Some of these are within a hare’s breath of giving a sell signal.
$NYA
$COMPQ
$NDX
$INDU
S&P Mid-cap 400
$CYC
XLF
IYR
XLE
OIH
KIE (look at the weekly volume)
SLX (very, very close to a sell signal)
$RIFIN/FAS
GDX & XME (should probably be in the list belowl)
DRG
$XTC
And now the bad news.
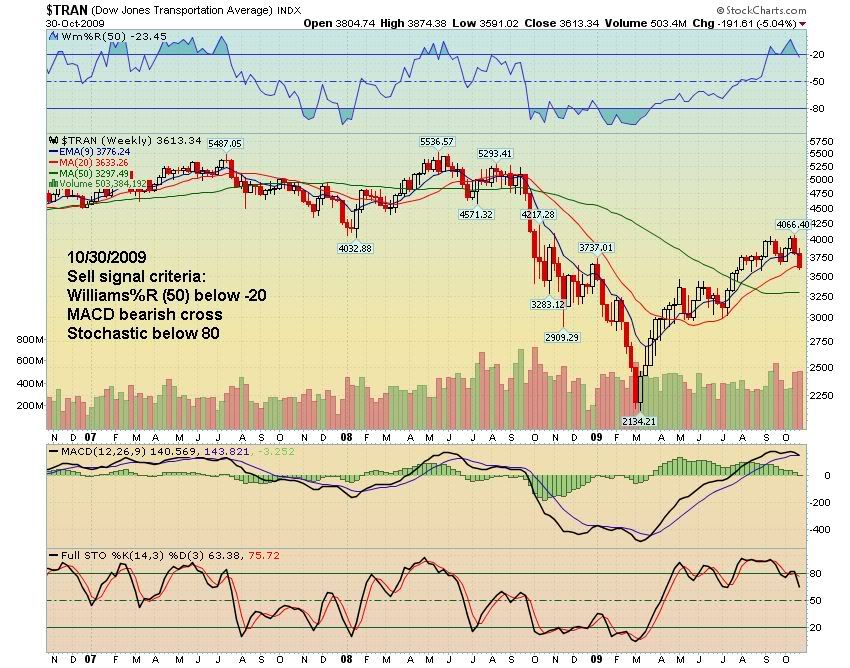
Using the criteria above, which is a break of trend line support on the weekly chart as well as a MACD bearish touch or cross, a stochastic below 80, and a Williams 50 below -20, these indexes and sectors have given ‘sell’ signals.
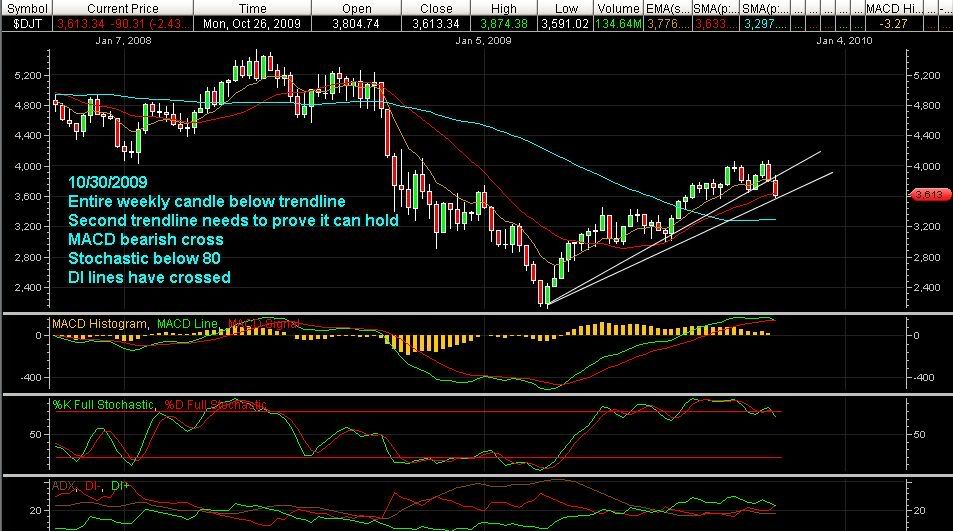
The poster child for this category has to be the $TRAN. This chart of the Transportation Index tells most of the story, and this chart tells the rest of the story. I’m not a Dow Theorist but anyone who knows anything about the stock market knows the importance of the Transports. If airlines aren’t hauling people and if trucks and trains aren’t hauling goods, then you do not have a thriving or growing economy.
Along with the $TRAN, the following indexes and sectors have also given sell signals on the weekly charts:
$SOX
$RUT
$BKX
$KRX
$HGX (a week ago)
TAN
XLU
XAL
BBH (two weeks ago)
BDH (since Sept 1st)
I’m sure a missed a couple.
Basically, the market is at a tipping point. Every index and sector is weak with some just being weaker than others. Lowry’s Buying Pressure Index is at its lowest level since the end of July and its Selling Pressure Index continues to rise. The SG’s for the $SPX and the $COMPQ indicate internal market deterioration, or rot, the likes of which have not been seen since February. The large contract commercial S&P futures hedgers are net short 50,000 contracts so the more they sell, the more they make. Earnings have been ‘better than expected’ but absolutely do not justify stock prices being back where they were before the big drop in September of 2008 or, in the case of stocks such as AAPL & BIDU, hitting new all-time highs. What we’ve seen in the past couple of weeks is bubble froth.
Based on what I’m seeing in the SG’s and what is being confirmed in the $TRAN, $RUT, $SOX, and other key sectors, I have to expect more downside. This does not mean that the rally is over nor does this mean that I expect the market to go into a major down trend and take out the March lows, as I’m sure many of the perma-bears are calling for. To me it just means that the market needs a cooling off period in order to consolidate recent gains after having come too far too fast. The $SPX has already dropped about 6% from its recent high and I have no idea how much further it will drop, if it drops at all. If the $SPX were to take out the July lows, then that would, IMHO, change everything. That level, around 870, would mean a drop of 20% from the recent high which would initiate a new bear market phase, but that’s a long way from the current 1036 level. In the mean time I’m still looking at a bull flag pattern on the daily $SPX chart. If the current downward move continues, then this will just morph into a down trending channel.
And lastly, or until I think of something else, I will leave you with this. Back in August, with the markets still rocketing higher from the July lows, the RSI 14 for many of the major indexes hit extreme levels not seen in years. At the time, I read an article stating that the RSI 14 for the $COMPQ hit a level that was comparable to the level it hit on January 3rd, 2000, which was 86.74. The article went on to point out that even though the $COMPQ would continue to rally over the next 2 1/2 months adding almost 1000pts, none of the subsequent new highs in the index were confirmed by the RSI 14 indicating negative divergence which eventually led to the the bear market in the $COMPQ that continues to this day.
Here are the levels from early August. On 9/22, with the $COMPQ 135pts higher than the August 4th high, the RSI 14 rose to 74.48 showing a slight negative divergence. At the more recent highs, the RSI 14 on the $COMPQ never got above 60. Is history about to repeat?

Update October 30th, 2009
6:20pm
Market rot. That’s what I’m calling this. The market has been decaying since the middle of the month. Yesterday’s rally was nothing but a dead cat bounce and today we got the real story.
Volume on IWM is now at 115mil shares. That’s the highest volume for a down day in a year. Today’s volume was heavy all around. Is it capitulation volume? Any other time I would say maybe but I’m even less certain than maybe right now.
The $VIX punched through its upper BB today, another sign that the markets are nearing a bottom, but there have been times in the past where this signal has failed, and I ‘think’ this might be one of them. This has to do with market deterioration the likes of which we haven’t seen since February. Back in February, when the SG for the $SPX produced signs of negative strength similar to the one it produced on Wednesday and today, this was indicating, at the time, that there were serious problems going on under the hood and that it was going to take more than a couple of days for the market to get on the mend and start back up. I ‘think’ we may be entering a similar period, if we haven’t already. If this turns out to be the case, then the market could easily drop for up to two weeks more and give back another 8%. I’m not saying this is going to happen but I see the potential for such an event.
P/C ratio hit 1.21 today. That usually signals a bottom is at hand but maybe it’s just not going to work this time. Will just have to wait and see.
Here’s some of the damage this market has done, and it’s not a pretty sight.
$BKX closed the month lower than the September low.
$SOX closed the month 1/2pt above its September low.
$DJT/$TRAN closed the month down 180pts and 450pts from the month’s high.
$CYC closed the month down 28pts and 90pts from the month’s high.
$COMPQ closed down 80pts for the month.
IWM closed down about $3.90 for the month and $6.20 from the months’ high.
$INDU closes the month out about 1/2 point higher but down about 400pts from the month’s high.
$SPX closes month down 21pts and down 65pts from month’s high.
* * * *
Current status for the SG’s for the $SPX & the $COMPQ:
Strengthening, confirmed, Phase IV sell signal.
Today’s signs of negative strength are on par with Wednesday’s, which were some of the strongest of the year.
* * * *
8:30pm
For the few of you who are still visiting this blog, I just want to point out again that this is uncharted waters for me. According to the SG’s, this pull back is nothing at all like the pull back from mid-June to -mid-July, or any of the others. The closest I can come up with is the late February period and so I am comparing the current numbers with that period. Any other time, the signs of negative strength that the SG’s are producing now would be considered climax signals, except when compared to the late February period. The numbers are not wrong but there is a chance that my interpretation of the numbers is. Regardless, there is no sense in trying to front run the market on the long side right now. The market will let us all know when it’s ready to go back up.
I just took a look at the COT report and see that, as of this past Tuesday, the large contract S&P commercial hedgers have reduced their long exposure at twice the rate of the reduction in their short exposure. Also, Alex Roslin say’s he’s going short the $SPX this coming Monday.
AAPL and GOOG have filled their earnings gap. AMZN?
And the USD was up.
Update October 27th, 2009
4:35pm
A Long’s worst nightmare. They sold AAPL today. Is AAPL going to fill that gap at $190.00, which I just noticed is a round # high.
There are things going on in this pull back that we haven’t seen for a while. $TRAN is almost all the way back to the 10/2 low. Same for the $BKX, $SOX, and the $RUT. XLF is now 15cents away from getting into the candle from 10/2. $SPX looks like it wants the 50MA.
A lot of people are saying that this pull back is partially due to strength in the dollar. I don’t know if there is any single factor, except for profit taking by the pro’s at a very opportune time. However, UUP looks like a buy right in this area. Not a recommendation but UUP hasn’t looked like a buy in quite a while. Volume certainly has found it’s way into the ETF.
AKS down over 8% today on easily 2x average volume. X down just shy of 8%.
We have a 3rd day of Distribution and that hasn’t happened in a long time.
V getting the smack down AH.
I day traded some TZA today and picked up a few shares of DRV, which I’m going to try and hang on to.
Be very careful. Retail longs continue to get trapped by the exiting pro’s as the market’s mean side has come to the surface.
* * * *
5:50pm
Current SG status for the $SPX:
Strengthening, confirmed, Phase IV, sell signal.
I am compelled by my data to call this a ‘climax’ signal, but with extreme caution. I will explain below.
* * * *
Current SG status for the $COMPQ:
Strengthening, confirmed, Phase IV, sell signal.
This is the strongest sign of negative strength I have on record, therefore, I am compelled to label this a ‘climax’ signal, but with extreme caution.
* * * *
I have to go with the data. The SG’s produced the strongest signals I have going back to March of 09′. However, there is a chance that we’re entering a period similar to that of February 09′ when signals like these were common place. Since I have no way of knowing if these signals mean a February-like decline, or if they mean the end to this current decline, I plan to play the long side tomorrow but only as a day trade. I will look for any weakness early in the session and jump on board then with a small position. If I had more confidence, I would start a small position in the AH. If the market does bounce tomorrow, then perhaps that bounce may last more than a day. Perhaps the bounce will just keep on going and we’ll start a new rally leg, but I will believe that only when I see it.
I absolutely do believe that any bounce will be sold into heavily by the pro’s and by trapped retail longs, until proven otherwise.
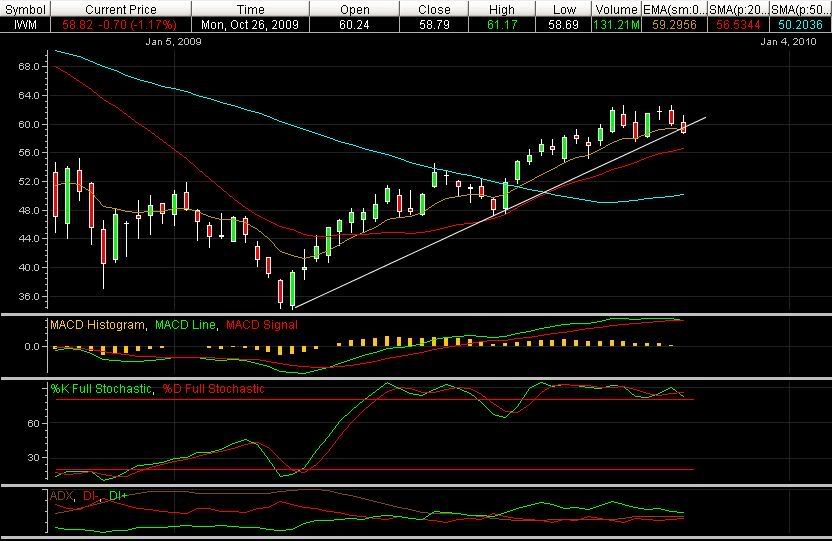
Take a look at this weekly chart of IWM. IWM has broken the LT trend line from the March lows. It’s not the only one. XLF and the $SOX are also in the same shape and the $TRAN is the worst of all with its entire weekly candle below the LT trend line. In other words, the market is in some serious trouble and without some kind of confirmation if we do get a bounce, then that bounce has to be eyed with great suspicion.
Obviously, the market had a change of heart about V.
Be careful. Watch position size. Don’t take your eyes off those M Patterns. Only the paranoid survive.
Update October 26th, 2009
4:20pm
More damage in the $TRAN today and it appears that the $CYC is playing catchup. For the $TRAN it does look like the swing low from 10/2 is in jeopardy.
Many of the financial ETF’s, etc, got hammered and appear to be running for their swing lows from 10/2. On a closing basis, $BKX and KIE are already there.
I’m watching SLG, PCL, & LRY, which are real estate stocks, to see how they do when their earnings come out sometime today after the bell. One way or another, their earnings will impact IYR.
Hope you were able to avoid or take advantage of the carnage today. I’m still in cash.
I’ll have more around 6:00pm, +/-.
* * * *
6:30pm
Current SG status for the $SPX:
Strengthening, confirmed, Phase IV sell signal.
* * * *
The SG for the $SPX had a substantial sign of negative strength today. In looking back at other time periods, the intensity of this negative strength is comparable to those that occurred on 9/2 and 10/2 which signaled climax bottoms. However, there are a couple of missing factors.
On both 9/2 and 10/2 the $SPX came down hard on very heavy, capitulation-type volume. By comparison, today’s volume was light.
On 9/2 and 10/2 the $VIX had punched through its upper Bollinger Band (BB). At the moment, the $VIX is miles away from its upper BB.
On 9/2 the, P/C Ratio hit .92. On 10/2, the P/C Ratio hit 1.11. Today’s P/C Ratio reading is .88 showing plenty of complacency.
As a result of this mixed message, I’m reluctant to label today’s SG signal as a climax signal but instead will just say that it has the potential of being a climax signal. The 60min chart of the $SPX is very over sold right now, as it was coming into today’s session, and so a bounce could be in order but if a bounce should materialize extreme caution should be used as it is not likely that the SG for the $SPX will be able to produce a sign of positive strength for several days.
* * * *
Current SG status for the $COMPQ:
Strengthening, confirmed, Phase IV sell signal.
* * * *
The SG for the $COMPQ also had a significant sign of negative strength today which totally contradicts the $COMPQ’s minor decline. In other words, there are problems under the hood. Just as with the $SPX, this negative strength compares to the 9/2 and 10/2 periods but I don’t see anything else that would lead me to believe that the signal today warrants being labeled as a climax move.
Here is the conundrum. When the markets came down in February of this year signs of negative strength like the one we had today in the $SPX were common and at the time would not have been seen as climax moves. Day after day there were very strong signs of negative strength. What if we’re entering such a period? If I only look back at data through the early May period, then today’s signs of negative strength stand out, but if I go back to the February period, then today’s signs of negative strength lose some of their significance.
I only mention this because this entire move up from the 10/2 lows never had a positive sign of strength and so within that context today’s negative sign of strength may not be signaling the end of this minor pull back but may instead just be more evidence of the overall weakness of the move in the first place.
Regardless, I’m going to set up my daily chart to track this current move as a bull flag and we’ll see which side of this pattern the $SPX decides to go. I am more than a bit concerned with the M patterns that I’m seeing in the daily candles and the Stochastic on the $SPX. This M pattern could easily morph into a W pattern.
You can also see M patterns in the $TRAN, $RUT, and XLF. And I’m sure there are other indexes and ETF’s out there that are displaying the same M pattern. For those of you who don’t know, W patterns are good and M patterns are not so good.
Update October 23rd, 2009
5:30pm
The market once again shows its mean side and I’m pretty tired of sounding like a broken record. Since I started getting really worried about this rally last Friday, the $SPX has only dropped 8pts, on a closing basis, and the $INDU is only down 21pts. So what’s the big deal? Look at the $TRAN, down more than 200pts since then thanks in part to disappointing earnings releases from CNI and now BNI. It was the $TRAN that signaled the last minor correction. The shippers got hit today, too. DSX, ESEA, EGLE, to name a few. Fertilizers, which have been pumped to the moon in the last several days, gave back a large part of those gains, especially AGU, but CF, POT, & MOS didn’t have such a great day, either.
The financial sector appears to have topped, and it did so on Wednesday, October 14th with, I think, GS’s earnings. All the biggies, JPM, GS, BAC, WFC, are under a lot of pressure and the XLF is already down about 4% since then. The $BKX is down even more, about 5.7%. This market cannot survive without the financials being front and center.
The $CYC, another very important index, at least to me, was down 1.5% today. The $SOX was down 3.2%, and the $RUT was down 2%. If it hadn’t been for MSFT’s and AMZN’s stellar reports, where might the sell-off have ended? And I wonder how long it’s going to take before the ether wears off and all those people who paid over $100 for AMZN come out of their daze and decide they better take profits before some other fool does.
We’ve had two distribution days this week: Wednesday & today. Based on what I expect to be some pretty serious signs of negative strength for the SG’s tonight, I think that we may get another major distribution day again next week.
But we’ll see. I still think there’s a chance we’ll go down and/or sideways for as many days as we came up off the October 2nd low. We may get a pull back more along the lines of the pull back that started in late June rather than the shorter term pull backs we’ve been getting since then.
I will up date the SG’s a bit later but I expect that I’ll be replacing ‘weakening’ with ‘strengthening’ is each status line.
______________________________________________________________
7:15pm
Negative strength continues to increase.
SG status for the $SPX:
Strengthening, confirmed, Phase IV sell signal.
The D Indicator has now hit bottom and should stay at this absolute low level until weakness wanes and strength comes into the market.
__________________________________________________________________
SG status for the $COMPQ:
Strengthening, confirmed, Phase IV sell signal.
The D Indicator has plummeted out of minor bullish territory two days ago all the way to its absolute lowest reading.
Interesting that since last Friday, the $COMPQ is only down 2pts.
_______________________________________________________________
News that Carl Icahn has left YHOO’s board appears to be having a negative impact on the stock.
Update October 21st, 2009
5:55pm
Every indicator dropped today for each of the SG’s. The SG for $COMPQ suffered more damage than the SG for the $SPX.
_______________________________________________________________________
Current status for the $SPX:
Confirmed, Phase IV sell signal.
________________________________________________________________________
Current status for the $COMPQ:
Partially confirmed, Phase III sell signal.
The D Indicator for the $COMPQ is still in bullish territory. Unless there is a mega rally tomorrow, this indicator should drop back into bearish territory and then the SG for the $COMPQ will go to a fully confirmed sell.
Many, if not all, of the financial ETF’s and sectors closed out the session below their lows from last week. $RLX and the $RUT suffered the same fate. Of the major sectors, the $TRAN took the biggest hit but the $SOX didn’t hold up all that well, either. There were slight increases in volume for the $SPX, $INDU, & the $NYA, but the $COMPQ and the IWM saw some fairly substantial increases in volume.
The pull back that I’ve been expecting since last week is now here. I don’t know how long it will last or how far it will drop. The SG’s had increased signs of negative strength today and once this starts in earnest it usually goes on for a few days.
I am long DRV from yesterday and I have to tell you if I didn’t have the SG, I would have bailed early in the session. And look at TZA. I had that sucker at $11.01.
su
Pre-Market Update October 20th, 2009
When the markets came off the bottom in March, the SG began to immediately produce signs of strength. On March 9th, the $SPX closed at 676 and then began moving up. The most sensitive A Indicator produced a sign of strength on March 10th. Throughout that week that ended on 3/13, the other indicators began moving up. By Tuesday, 3/17, the D Indicator had the first part of its two part bullish confirmation. By 3/18, all the indicators had bullish confirmations all while the A Indicator continued to produce signs of strength.
This same type of scenario played out in mid-July and again off the September 2nd low with the A Indicator producing a sign of strength immediately and the remaining indicators confirming the rally within days. But this isn’t happening now.
After rallying almost non-stop for the past 11 sessions, the SG for the $SPX and the $COMPQ have yet to produce a sign of strength. Normally the C & D Indicators would confirm a move, up or down, no later than seven sessions after the move began. This rally is so weak that it has taken almost the entire 11 sessions to produce confirmations in these two indicators.
So what does all this mean? I’m not really sure. At the very least it is a warning that there is something wrong with this rally leg, but that can all change with a sign of strength. I do think that until there is a sign of strength that it’s best to remain vigilant and to watch the various leading sectors for any hints of a change of direction. Until then, the trend takes precedent and that means up. And while it’s important to me that the markets produce a sign of strength soon to confirm this rally legs validity, this doesn’t appear to be of any importance to the rally itself.
I will be watching the $VIX with Bollinger Bands over the next several sessions. The $VIX has been crawling along the lower BB in the recent days. Will the $VIX punch through the lower BB today or tomorrow?
At this writing, the PM high price for AAPL is $203.23. Is any price too high for AAPL?
People are already talking about Dow 11,000 and for all I know we could hit that level before the end of the month.
