Archive
Weekend Update April 10th, 2011
$NDX/$RITEC:
With AAPL being reduced to 12% of the $NDX, it won’t be as easy as it used to be to manipulate the price of the Q’s. $NDX may start to move more like $RITEC, which has been underperforming.
Zweig Breadth Thrust signaled a consolidation period ahead and so far that’s all it’s been with most major indexes essentially flat on the week. Exceptions would have to be $CYC, down 1.68%, and $TRAN, down 2.65%. So, is that it? Is the consolidation over? I have absolutely no idea. If oil were to suddenly drop then maybe.
Bulls vs Bears
Bullish:
P/C Ratio at .87 is slightly bullish for Monday.
$NYHGH slight positive divergence last Friday.
$BPSPX +.20 last Friday. At 82.60 this is back in the mid-80 range that, prior to this latest move, has been a cautionary level meaning that one has to be careful adding to longs as this is showing overboughtness. Back in December, when $BPSPX first entered this mid-80 zone, $SPX was trading at around 1250.
RSI 14 on 60min charts of $TRAN, $CYC, and IYR dipped below 30 in Friday’s session with each rising above the 30 line by late in the session.
Bearish:
Zweig Breadt Thrust at 51.58 is dropping quickly.
$SPXA50R at 70.20 has lost the important 75 level.
Sell signals in the 60min time frame for $TRAN, $CYC, IWM, & IYR with judgement call sell signals for $SPX and other key sectors. By that I mean that these have closed below the 20MA in the 60min time frame and are either just above or just below the most recent trend line. They could go either way.
Sell signals using the 3EMA/10MA method for $TRAN, IYR, $CYC and others. Be careful using this set up because it will whip saw you to death.
$NYSI & $NASI had negative ticks last Friday. They started losing momentum early in the week so this was expected. At this time, these are showing indecision so even though I’ve put these in the Bearish section, they aren’t really that bearish, yet.
$VIX with 5EMA is bearish and potentially very bearish. But as you can see from the linked chart, it can also be very early.
Oil.
ECB rate hike this past week which raises the possibility of rate hikes here.
Neutral:
Just about everything else I watch, from the cumulative $NYUD to the cumulative $NYAD, is giving neutral or confirming signals. In other words they are moving in sync with the latest move. Since they are moving down with the markets, then it will be important to watch for a positive divergence in these and others.
* * *
The markets can move up without some key sectors, but they’re not going anywhere without $TRAN. Usually about the time one or more key sectors become obviously weak, then The Buyer shows up and we’re off again.
This chart shows that $TRAN has broken its most recent up trend line. From its swing low in mid-March to its most recent swing high, $TRAN moved about 10%. Since its April 2010 high, it has moved about 8% higher so this latest little rally leg was most definitely parabolic. I’m using Fibonacci fan lines on this chart because they seem to fit well and they give some kind of an idea about potential support levels. IMHO, support is pure Voodoo, akin to ‘targets,’ so you don’t buy some phantom support level. You just sit tight and wait and see what happens when these levels are approached. Meanwhile, $XAL has been on a ‘sell’ signal since December and looks to be headed lower. On Friday, some of the airline stocks in the transportation index were down 6%, but then The Buyer showed up and defended price and they closed off those lows, though not by that much.

Chart courtesy of StockCharts.com
It’s all about oil now as we remain hostage to this important commodity. Until the price of oil stabilizes and/or begins to drop, then pressure on transport stocks will persist.
AA reports Monday after the close of trading. Apparently there are high expectations for AA and they’re expected to earn .27 cents a share. Last year, on the 13th of April, AA dropped a little after the release of earnings on the 12th. Because AA has been pumped to the moon over the past three weeks, I would expect that, regardless of earnings, AA will get sold off on the 12th and maybe beyond. But I could be wrong.
Paranoia works well at times like these.
GL in the week ahead.
Weekend Update March 27th, 2011
All of the market breadth indicators that I follow are staying in sync with this move. While negative divergences did not work from the time they began to appear in late September of 2010, I do think a negative divergence or divergences at this stage of this nascent rally leg could prove to be problematic.
$NYSI daily chart showing how the Summation Index has apparently bottomed and is now trying to right itself and move up. It will take most if not all of next week before $NYSI confirms the rally with a fresh buy signal indicated by one or more upward crosses of the MA’s. This is a direct link to a weekly chart using a 5,3,3 sto, which is showing to be oversold at the moment. That sto should/could/better turn up next week, if you catch my drift.

“There are known knowns. These are things we know that we know. There are known unknowns. That is to say, there are things that we know we don’t know. But there are also unknown unknowns. There are things we don’t know we don’t know.” Donald Rumsfeld
$SPX daily chart that epitomizes the known unknown and the unknown unknowns. The unknown here is why the $SPX stopped at this falling trend line. Was it coincidence or perhaps alien intervention? I just find it interesting that it stopped where it did but it does bring into question whether the last few days of up moves are anything more than a dead cat bounce. A close above this falling trend line on Monday is going to be important and since that is a falling trend line then $SPX could close flat on the day and still close above it. Then, of course, there’s the potential Bear Flag that would start to lose most of its credibility with a close above 1332. Until then, it will be important for $SPX to stay above the Pyscho/Voodoo level of 1300 because a failure to hold that level would mean that the short term MA’s on the chart would be breached to the down side and would then start to roll back over. IMHO, however, this is a bullish looking chart.

Charts courtesy of StockCharts.com
That potential Bear Flag pattern on the daily chart is the rising trend channel on the 60min chart. Based on what I’m seeing in the market breadth indicators, I have to give the benefit of the doubt to the bullish rising trend channel rather than to the potential Bear Flag, but a paranoid trader has to consider all options and escape routes.

The $INDU, XLB, IWM, $MID, XLI, $TRAN, $CYC, and I’m sure others, have already had bullish DI X’s and with this kind of leadership you have to expect other key sectors will follow, or famous last words.
I’m not sure to whom the following should be attributed, but there’s an old Wall Street saw that goes like this:
“The market is all about taking the most amount of money from the most amount of people in the least amount of time.”
GL in the week ahead.
Weekend Update, December 26th 2010
History. Is it of any use in gauging overly bullish or overly bearish levels of sentiment that often mark turning points in the market? I say it is because human nature hasn’t changed in thousands of years and it isn’t likely to change in the next few weeks. But does sentiment matter to the Fed, which seems to be one of the major participants in the market? And if sentiment doesn’t matter to the Fed, then how does one explain what happened in April?
I was going to put up a couple of sentiment-related items and then I saw Babak’s post over at Trader’s Narrative. I would only add one thing about his recent ISEE posts.
Babak noted that the ISEE #’s could be skewed somewhat by heavy call buying in several of the financial sector stocks, most notably C. I agree with his analysis that such heavy call buying may have skewed the ISEE #’s in the current period and that this heavy call buying is consistent with the type of heavy call buying that we saw in April which evidenced extreme levels of euphoria that led to the April top. Click here to read Babak’s post over at Trader’s Narrative.
Here’s something you don’t expect to come from one of the Fed banks, but based on the current yield curve, the Cleveland Fed is predicting 1% GDP for 2011.
$BDI: There is certainly a lot of chatter going on about this index, and rightly so. However, there have been several articles at Hellenic Shipping News, link to your right, that indicate to me that $BDI may soon bottom. For instance, Dryships (DRYS) is ordering 12 tankers from a Korean shipbuilder at a cost of more than $700 million, MAERSK Lines is raising bulk rates, and Nippon Yusen, Japan’s second largest bulk shipper, is expanding its fleet to accommodate growing demand in India for coal and iron ore.
Insider Selling: I have read several articles lately that suggest that the huge amount of insider selling has been caused by the potential expiration of the Bush tax cuts, and I don’t buy that one bit. Why? Well, our D.C. reps are owned by big business and these powerful titans of industry knew full well that the Bush tax cuts would be extended. Of course these insiders are entitled to profit from their positions but they do seem to be heading for the exits at light speed.
$VIX: After hitting a multi-year low this past week, the $VIX bounced on Thursday. Bull Luby at Vix and More, link to your right, has some interesting things to say about the recent action in the $VIX. I still think there’s some more downside left for the $VIX and the other volatility indexes, but I don’t know if that matters. When the $VIX bottomed last year in late December, it’s subsequent rise didn’t impact the market for several weeks. And, of course, there were other factors at play during late December of 09′ and early January of 10′ besides a rising $VIX. And if the $VIX were to rise over the course of the next few weeks, don’t expect the market to react the way it did in January. That would be just too convenient, don’t you think?
QQQQ: While the $RUT, $TRAN, $CYC, $SOX, & $SPX have had some decent moves since hitting intra-day highs in November, the Q’s have languished due in part to the consolidation in AAPL. When AAPL came out with earnings on the October 18th, they warned that increased labor costs would cut into their profit margins going forward. The stock stumbled a bit but regained the pre-release level. Two or three days later, AAPL once again came out with the same warning and the stock went into a brief decline from which it has recovered. AAPL owners are a smart lot and they didn’t fall for the ruse. They knew that AAPL issued the warning so that AAPL could handily beat estimates when they release earnings in late January of 2011 and the stock would rocket higher, or not. Since its last earnings release on 10/18, AAPL is up about 6% while the $COMPQ is up about 7.5%. Christmas sales appear to be strong and this will benefit AAPL and if AAPL does move up then so will the Q’s, but at the moment the Q’s are underperforming.
$NYSI: I get cognitive dissonance when the Summation Index is not confirming moves in the market. Back in late March and all through April, the $NYSI floundered and warned that there could be trouble ahead. While the $NYSI has improved over the last few sessions, it is still floundering and doing so below the important 500 level. However, as long as the $NYSI is moving up, then this means that weakness is being supplanted by strength. It does appear to me that $NYSI could be getting ready to put in a lower high, like it did in early November, but that remains to be seen. While the $NYSI indicates, at least to me, that the market isn’t as strong as recent gains would have you believe, as long as the $NYSI does continue to rise, then bulls remain in control, regardless of how tenuous that control appears to be at the moment.

$TRIN: I’ve been going on about the $TRIN as I like the fact that, unlike the $VIX which can go to zero or 80, the $TRIN moves back and forth across the 1.00 level and can be tracked with MA’s. I’ve been using various MA’s over the past couple of weeks but I’ve been looking for a better MA. I like the combination of the 14MA and the 21MA but I found this article from Dick Arms in which he shows how to use the 55 day MA. The parameters for using each of the MA’s are clear with the 55MA giving perhaps the best signal. The problem is that the 55MA doesn’t often reach Arms’ overbought level of .90. On Tuesday, December 21st, the 55 MA hit 1.01 and has since moved up. I don’t know if the 55MA for the $TRIN can get into the .90’s but it is possible since the week ahead shouldn’t be too volatile (famous last words?). The $TRIN closed at 1.61 on Thursday so in order for the 55MA to break into the .9x level, the $TRIN is going to have close below 1.00 almost every day next week, which is a regular five-day week, by the way. If the 55MA were to drop into the .9x area in the coming week or weeks, this would serve to confirm what is already happening with the 14MA and the 21MA. Ultimately a confirmation by the 55MA may not be necessary.
You can see on the chart below that over the past two years there have been four instances when the 55MA has dropped to or below the 1.05 level and that so far only two of those instances produced a negative market reaction.

Charts courtesy of StockCharts.com
There is no POMO $$ coming into the market in the week ahead (Wrong: Coming in Thursday & Friday) but there should be a residual effect from last week’s huge injection. China’s rate hike probably won’t mean a thing to our 100% manipulated markets as Bernanke and his minions will be there to provide liquidity in case the market should react cautiously or negatively. Or not.
$BPMATE, which is the materials sector, is at 95.75% which means that 95.75% of the stocks in this sector are ‘buy’s’ based on point & figure charting. This is the highest reading for this index going back ten years. If the Chinese rate hike has any impact at all on our markets, it will hit this sector hardest.
$BPTRAN is at 95%. It can go to 100% and stay at 100% for a week or so, like it did right at the April high, but it need not do so.
$BPSPX is at 84.80% and has been in the mid-80 level for three weeks. It may stay at this level for longer than I first anticipated, which was three weeks, but it need not do so.
Be careful in the week ahead. One can truly never know ahead of time when the ether will wear off.
Weekend Update December 4th, 2010
Just want to start with something I’ve said in the past but that bears repeating. The stock market and the economy are two separate animals and have nothing to do with each other. At times these two animals appear to be moving in sync with each other but this is pure coincidence. On Friday you saw this in action. While shortz were expecting the market to sell off big time due to the hike in the unemployment #, the market instead went up. This is because the market moves the way the big players want it to move and if THEY want the market to go up, it will go up. When the mad men at the helm want the market to go down, the market will go down and will probably do so during periods when there are good economic reports. Our #1 job as traders is to try to identify what the mad men are doing and to ride their coattails. Fortunately the mad men at the helm leave large footprints and right now those footprints are headed north.
Another thing that’s important to keep in mind is that when the market goes down it’s under accumulation and when it goes up it’s under distribution. I have shown several charts over the last few months where, in the 15min time frame, there were huge red candles and warned to never short such a candle or even a series of such candles because those candles are signs of manipulation by the big players. First, these big players are selling longs into the previous price increase and then going short. Next, these big players start to dump their remaining longs ‘at the market’ which causes others to do the same. This selling pushes the market down and as it’s going down the big players are covering their shorts and picking up shares on the long side at bargain basement prices. Then, once the big players have covered most of their shorts and have added most of the longs they want, they’ll start to buy ‘at the market’ which then pushes stocks up creating excitement and retail traders who don’t want to miss the gains jump on board which keeps the move going. When retail traders start to jump on board, the large players sell their longs to the retail traders and the cycle repeats. I believe that the computer systems that the mad men at the helm use trigger off overbought and/or oversold readings in the RSI 14 in the 15min and 60min time frames which is the basis for the 60 minute trading strategy.
******
Bulls vs Bearz
Wild cards: Groupon has rejected GOOG’s huge offer. I don’t follow GOOG that closely, but GOOG did move 20$ off it weekly low and if this was due to expectations of the Groupon buy, then GOOG could get hit pretty hard on Monday which would impact the $NDX and $COMPQ directly. POMO $$ as usual and no way to tell how this $$ is being used though it is intended to prop up equities.
Bearz:
$TRIN & 5 Day Arm’s Index: Well, $TRIN closed at .68 on Friday and this dropped the 5 Day Arm’s to 3.03. (Please see my November 27th post.) Last weekend, the 5 Day Arm’s Index had a reading of 8.32, which was showing oversold. This week’s 3.03 reading is showing the exact opposite. A reading around 5 is neutral and a reading near 4 would be considered somewhat bearish so this low 3.03 reading is cause for concern and you have to wonder if everybody’s in. Also, on Wednesday, the $TRIN closed at .27 which was telling me that there was a lot of forced buying going on. In other words, short covering, IMHO. So if the shortz have covered and all the longs are in, what’s next?
ISEE All Equities: Two very high readings this week of 327 & 296 which is telling me that the long side is getting very crowded. When we started to get very high ISEE readings back in April, the market ignored these for a couple of weeks, then fell off a cliff.
P/C Ratio: P/C Ratio closed at .79 on Friday which is bearish, though not extremely so. It closed at .70 on Thursday which didn’t seem to impact the market one bit. I think two days of readings in this area may be a little too much, but the market will make the call.
RSI on 60min Charts: RSI’s on the 60min charts for all the market leaders, $TRAN, $SOX, $RUT/IWM, IYM, and even SPY, all closed above 70 and this indicates that the market is very overbought at the moment. This overboughtness can get worked off in one of two ways: The market can pull back or it can consolidate sideways for a few days.
This chart of $SOX index looks very much like the chart of the $RUT I put up on Friday, and they both say that buying has pulled in just about every last buyer out there and that to attract more buyers you have to adjust prices lower.
Click here to open chart in new window.

Chart courtesy of FreeStockCharts.com
Bullish:
Commitment of Traders Report: If you’ve been following Alex Roslin’s COT Blog, link to your right, you know that the commercials are still short the large contract ES futures. So far they’ve been fueling each and ever short squeeze but haven’t given up yet. Here’s what’s interesting or maybe coincident about that. Last year during this same period the commercials were getting heavily short. I chronicled it on this site and it was pretty amazing to watch. And then suddenly, during the last two weeks of December, perhaps to clear the books going into the new year, they cried uncle and got out of all most of their short positions. Interesting that about two weeks later, around January 11th, the market topped out. I have no idea if this kind of scenario will repeat again this year. Just throwing it out.
$VIX: $VIX tagged its upper BB on Monday, closed above it on Tuesday, and has pulled back since then creating a new buy signal in the process. As long as the $VIX keeps dropping, then the market should keep rising.
$USD: The dollar may have peaked, though it’s probably too soon to tell. POMO $$ is supposed to weaken the dollar but POMO injections didn’t stop the dollar from rallying over the past month. Meanwhile, the Euro is setting up to give a new buy signal, per the 5/10EMA method.
90% Up Day: 93% up day on December 1st which is what you want to see at market bottoms. We also had a 90% up day on November 24th, which followed a 92% down day on November 23rd.
SG for $SPX: Three of the four indicators that I use to calculate the SG have started to move up which indicates a change in trend.
$BPSPX: $BPSPX hit a new rally high on Friday of 79.80 and its stochastic has now moved above 80. This is good for now and confirms the rally but we need to be watching for readings in the mid-80 area. Based on past history, when $BPSPX gets up into the mid-80 area, assuming that it does, it can stay up there for about three weeks. After that, when $BPSPX starts to roll over, it’s time to take profits. Just sayin’.
$SPXA50R: This moved back above 75 on Thursday and went to 77.80 on Friday, which confirms the market is moving up with broad participation.
Breadth Indicators: Every single breadth indicator that I follow, from $NYMO, $NAMO, Zweig Breadth Thrust, Cumulative Volume Index, etc, is confirming the move up.
Chart of $NYSI w/ ADX showing that the +DI line is moving up and that $NYSI is getting close to pushing above the 5EMA. BTW, you can substitute RSI 14 for the ADX and you’ll get the same reading. I just happen to like the visual aspect of the ADX along with the ADX line, itself.
Click here to open chart in new window.

Chart courtesy of StockCharts.com
The bottom line is that the market is moving up with strength and on pretty good volume, but that it may have gotten a little ahead of itself and may need to cooling off period based on very low Arm’s Index and very high RSI readings in the intra-day time frames. We could either pull back for a session or two or just go sideways to work off some of this overboughtness. If the markets do pull back, I would really want to see the $SPX hold above 1200 as this is an important pycho round #. On the other hand, if $SPX pushes above the November 5th high of 1227 and fails, then this truly could be a double top signal which would first be confirmed by a break of 1200 and then 1173. I have my doubts about a break of 1200 mainly because I think the PPT will intercede and save the day, but I could be wrong.
It’s always the Yin & Yang, the double edged sword, the dangerous opportunity. One day the glass is half full and the next day it’s half empty. As any paranoid trader knows, holding a particular view for too long can be costly.
GL in the week ahead.
Weekend Update November 27th, 2010
The big wild cards in the coming week are going to be news driven. From Xmas shopping, to North Korea, to problems in Europe. The markets are currently held hostage by news events as most earnings reports are out of the way.
Bulls vs Bears
Bullish:
$BPSPX ticked up on Friday even as the market dropped. It is now within 2.6 percentage points of its November 8th high. The stochastic is now below 20 and may start to move up in the next few sessions. Maybe. Not adding to long positions or initiating new long positions while the Sto has been dropping continues to be a fairly good strategy.
$NYUPV closed at 78.10 on Friday. I’m not sure how reliable this reading is given the 1/2 day of trading. $NAUPV, which I really don’t follow as closley as $NYUPV, closed at 204.78, the same level it hit on November 16th, but I’m not reading much into this, either, given the 1/2 session.
$NYUPV:$NYDNV hit .22 on Friday. When this ratio gets into this area, it usually means that the market is very oversold, but, like $NYUPV, this ratio may be skewed due to the 1/2 session.
$VIX nearing upper BB. $VIX may tag its upper BB on Monday. A bounce of some kind may or may not follow.
POMO $$ coming in on Monday, not Tuesday as I posted previously. $33 billion minimum throughout the week. While this hasn’t led to any rallies lately, POMO injections may be what is keeping the market in its current holding pattern.
$TRAN, $CYC, $SOX, $RUT, $NDX, $COMPQ, RTH, XLE, & $XAL remain ‘holds’ per the 9/20 cross method.
P/C Ratio closed at .85 which is only slightly bullish, IMHO.
$TRIN closed at 2.13 on Friday and has pushed the 5-day Arm’s Index to 8.32, which is clearly oversold. This should/could mean that the bulk of selling is over for now but that doesn’t mean a bounce on Monday. Insider selling could be skewing the daily $TRIN readings. See below.
Bearish:
See Chris’ $SPX Signal Watch Table, link to your right.
Insider selling reaches an unheard of 8000:1 ratio in the past few days. Insiders are expected to increase their selling as the new year approaches in order to avoid paying an extra 5% on their capital gains. The new capital gains tax increases from 20% to 25% on January 1st. This selling is increasing the floats in many stocks and will ultimately have a dilutive effect on the value of stocks and earnings per share going forward.
$SPX, $INDU, $NYA are ‘sells’ per the 9/20 method and need to get back above their respective 20MA’s ASAP. I think most of their problems are coming from the financial sector so until XLF, $RIFIN, IYF either bottom or start moving up, then you just have to expect the majors to languish.
$USD in a strong up trend and like in the past this is putting pressure on most equity classes, but $SOX and $TRAN have so far only been negligibly impacted. If $SOX and $TRAN do start to languish due to $USD strength, then $NDX/$COMPQ & $RUT will follow.
$SPXA50R dropped by 5 percentage points on Friday to 62.20%. Until this starts to rise consistently and gets back above 75%, then longs beware.
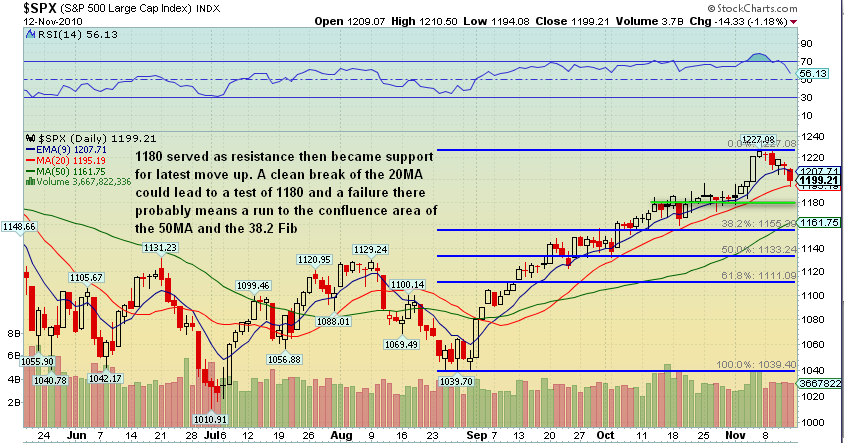
Chart of $SPX showing first a bull flag pattern and break out and now what could well be a bear flag pattern. The bear flag would be confirmed, at least initially, with a close below 1180. A close below 1173 could open the door to a serious drop, IMHO, of course.
Click here to open chart in new window.

$NYMO & $NAMO remain below the zero line. It looked like they might get above zero but Friday’s sell off prevented that.
$NASI & $NYSI are locked in a down trend and until these two base and start up, longs are at risk.
Chart of $NYSI showing various stages of current ‘sell’ signal.
Click here to open chart in new window.

Charts courtesy of StockCharts.com
No Lowry’s data this week as Puplava is at the San Francisco hard assets show, but I think it’s safe to say that Lowry’s current ST sell signal remains in effect.
The $SPX is now up about 6.6% or 74pts for the year which isn’t really a bad gain but is far from the 25% gain that I predicted on January 1st. And of course it could easily drop 6.6% at any time which is why I say that money in the market is money at risk. I own shares of a Ginnie Mae Fund and those shares will return, on a compounded basis, a little more than 6% this year and will do so with little or no risk. While I spend several hours each day going over stock market data, I only spend a few hours a year managing my Ginnie Mae fund. Since I believe that 2011 is going to be a much tougher year for traders than 2010 and will require countless hours of work in order to stay in front of or with the trend, I am seriously considering following insiders out the door. I can, of course, change my mind at any time, but one thing I’m not going to change my mind about is my last post on this blog, which will be January 1st, 2011.
Only the paranoid survive.
GL in the week ahead.
Weekend Update, November 13th, 2010
Bulls vs Bears
The wild cards in the coming week are going to be the $USD and POMO injections. I have a buy signal on the dollar using the 5/10 EMA set up and the 9/20 cross method. I have seen many times in the past when the dollar went up along with the market and many other times, most recently August, where the dollar went up and the markets went down so we’re just going to have to see how this plays out. Dollar weakness has garnered a lot of bad karma lately so it could run higher for a while.
There will be a POMO injection every day next week with a minimum of about $31 billion dollars coming into the market. Going to be interesting to see where that money is put and how it impacts the markets.
Bearish:
All of the major indexes have either had a Bearish DI X or are on the verge of one. If there is no bounce Monday, then all the majors will have these Bearish X’s.
Using the 5/10 EMA’s, I now have legitimate sell signals on 13 of the 36 indexes and key sectors that I follow. $SPX and the other major indexes are closer to getting a sell signal now than they have been at any other time since the rally began and so if there is any red on Monday they will all get sell signals.
$USD buy signal, as mentioned above.
$VIX buy signal using 5/10 EMA’s, close to getting a 9/20 Bullish X, and already has a Bullish DI X.
$NYSI & $NASI had substantial drops on Friday indicating market weakness. As mentioned in my Friday post, the -54.54 drop for $NYSI was the largest since the -58.87 drop on August 26th.
Click here for current chart of $NYSI with ADX.
$NYMO & $NAMO both well below the zero line.
$BPSPX has dropped 3 out of the last 4 sessions.
$SPXA50R dropped below 75 on Friday. Could have peaked and getting ready to drop down toward the 25 area.
$NYUPV closed at 104 on Friday. While this does indicate that market is oversold it is not low enough to signal that selling has climaxed.
$NYHGH dropped to 43 on Friday. This is the lowest reading since early July.
$NAHGH dropped to 47 on Friday, which is the lowest reading since mid-September.
Zweig Breadth Thrust dropped to 43.78 on Friday. ZBT still has several points of downside left before it flashes an oversold signal.
Click here to open chart of ZBT in new window.
P/C Ratio closed at .97 on Friday. This is showing an increase of fear over what we’ve seen lately, but, IMHO, it just isn’t high enough.
Bullish:
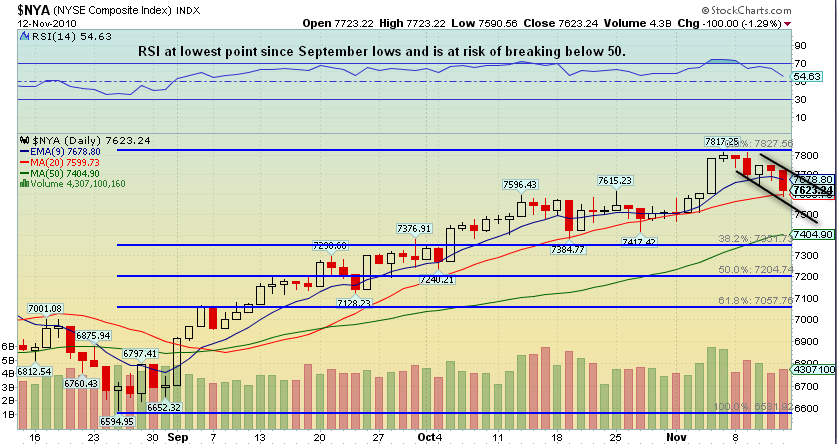
RSI in the 60min time frame on almost all major indexes dropped below 30 during Friday’s session. As mentioned Friday, this has not happened since the September lows and is an important factor in the 60min trading strategy. If the various indexes that experienced this on Friday can rise to break their down trends and get back above their 20MA’s then this would be a bullish sign.
$NYSI dropped by 54pts on Friday. During the August decline, the biggest drop for $NYSI was 67 pts so either $NYSI is very near to giving a climax sell signal or already has.
$NYMO and $NAMO smashed through their lower BB’s on Friday. In the past, this has worked fairly well in signaling that the market is way too oversold. Will it work this time? Does anything work all the time?
$NYAD, the daily, dropped to -1954 on Friday. In the past, readings in this area have marked bottoms. Do your own due diligence on this one so you’ll know what I’m talking about. You don’t have to go further back than the end of June.
$NAAD, the daily, dropped to -1550 on Friday. See above.
$NYUD:$NYUPV dropped to -7.6 on Friday. As mentioned in my Friday post, this is in an area that in the past has marked bottoms but you really should do your own due diligence on this so you’ll see what I’m talking about. A reading 4 to 5 pts lower would be better.
90% down day for the $NYSE. This is what you see at bottoms. You can use the Wall Street Journal link to your right and then go back and look at the days near the August/September lows.
ETF Investment Outlook is showing that many of the key ETF’s that it follows are very, very oversold. Some, including IYT, did not have a single stock close in the green for Friday. While this is a sign of weakness in the markets it is also a sign that the selling may be a wee bit over done.
4 Week New High/Low Ratio closed at 20 on Friday. 10 would be better and that may get hit on Monday. This is T2122 over at FreeStockCharts.com
The bottom line is that the markets are oversold enough at present to initiate a bounce but may need another day or two of selling to seal the deal. News out of Europe regarding Irish debt and news out of China regarding interest rates may already be priced into the market and if there is any good news out of either of these countries, then you would have to expect the market to react favorably. If there is some more selling early next week, then $NYA could easily drop below the 20MA and head down toward the 38.2% retrace, 50MA, and round # support level around 7400. Big Tech was the engine that powered the markets to their recent highs, and they’re going to have to take a leadership role again. Until then, the markets are at risk of further selling.
***Added Sunday, November 14th:
Chart of $SPX with support line and Fibs.
Chart of the SG for the $SPX showing how the recent up trend was broken. As long as it continues to move down, then longs are at risk.

There is no lasting cure for paranoia so don’t worry about it.
And remember, the difference between genius and stupidity is that genius has its limits.
Have a good weekend.
Weekend Update November 7th, 2010
The Exuberatti showed up again on Friday. This is both good and bad, the yin and the yang, the dangerous opportunity. Bulls and Bearz will want to see this continue. Bulls need others to pile on behind them and Bearz will be watching for too much exuberance which could indicate that the market may have gotten ahead of itself and may need a cooling off period. Back in the March/April period, the Exuberatti showed up at the first of April but this didn’t impact the markets for almost a month. Comparing the market to the March/April period may not be wise because I think the only other rally that is a valid comparison is the March/April/May/June rally of 2009.
During March of 09′ the Fed began its purchases of U.S. Treasury Bonds, only they didn’t call it POMO back then. Back then the Treasury sold bonds to GS and after a couple of days, GS sold the bonds back to the Fed. The agreement between the Fed and GS is now obvious: provide liquidity to the equities markets or in layman’s terms, buy the dips.
Between the March 09′ bottom and late May of 09′, the market had eight 90% up days. And during this latest rally off the September/August lows the markets have had six 90% up days. No other time frames since the March 09′ low that I’m aware have had so many 90% days. My confusion with these days came about because one of the key characteristics of market tops is a 90% up day some time after a rally has been going for a while so when I saw that 90% up day on September 20th I figured the market was getting ready to roll. Then there was another 90% day on September 24th, and I was even surer. But obviously the market didn’t roll and that is because I was comparing the current rally to the wrong rallies of the past, or so it seems to me at the moment.
This past Thursday, we had a 97% up day and if my current thesis is correct then this has to be taken at face value and not as a climax buying event. But, of course, I don’t have a crystal ball and I could be very, very wrong about this.
P/C Ratio closed at .69 on Friday
ISEE All Equities closed at 251 on Friday
These two have in the past have worked well in warning of potential pull backs in the following session and lately these pull backs have been short lived buying opportunities so we’ll have to see if this holds true for Monday.
$SPX, $INDU, $NYA, $SOX, $COMPQ, $CYC, $RUT, and even XLF are either just at the upper BB or way above it. These probably need a rest and maybe a little pull back. Yeah, sure.
POMO Monday so who knows how this will play out. Maybe the only thing that will happen is that POMO recipients will, by agreement, buy the dip, should one occur, and contain the selling but not necessarily drive the markets back into the green. Next POMO schedule to be released on Tuesday and with QE2 then this will now continue for the next 7-8 months.
There was an article on the Nikkei Stock Exchange’s front page Thursday evening, their Friday session, that told how the Japanese govt was going to start buying ETF’s of the Nikkei. I was shocked when I read this because it reeks of market manipulation which I, of course, do not believe in.
Lowry’s issued a ST buy signal this past Tuesday. I have been having a tough time reading the markets lately but when I think about Lowry’s filp flopping back and forth over the past few weeks, with all their high powered computers, years of experience, and unimaginable data streams with Ph. D. math wizards to interpret it all, then I don’t feel so bad.
Op/Ex week so have to expect some volatility.
My simple mechanical trading system alerted that KRE was about to get a buy signal the other day. This has happened, and it happened in XLF, as well. I follow around 30 different indexes and sectors and using this system I can check them all in just a few minutes. Out of these 30 or so indexes and sectors, I only have Sell/Avoid signals on $VIX, $USD, $BDI, TLT, and BBH. Don’t be surprised if on Monday AMGN and & GILD find buyers and reverse the sell signal in BBH. I don’t know about TLT. $USD had a nice bounce Friday but it’s done that before and nothing has come of it and in light of QE2 then it probably doesn’t mean much. Famous last words?
Chart of KRE using my simple mechanical trading system.
Click here to open chart in new window.

Chart of the Big Daddy of breadth indicators. Note that the DI lines have had a bullish cross and that the ST EMA’s are already confirming the buy signal. If we really have started a new leg up, then $NYSI will rise over the course of the next few weeks to the 1200 level, +/-. This level has stopped $NYSI in the past but with the POMO wild card this may not be the case this time.
Click here to open chart in new window.

Next, a weekly chart of the $BPSPX. If you remember a couple of weeks back I was fairly certain that $BPSPX would rise into the low 80’s and then we might be getting over bought enough to initiate some kind of pull back. Well, the market consolidated instead of rising so that has now been pushed out. You can see on the chart that once $BPSPX gets into the mid-80’s it can stay there for three weeks or so before rolling over and bringing the market with it, or vice versa. $BPSPX rose 4.40pts this past week. If that rate should continue, then $BPSPX will be in the mid 80’s before the end of the coming week. Then it could take one more week to get above the 85 level and once there could stay there for two three weeks. Of course, anything could happen in the mean time, but unless something comes out of the blue, then it does appear that this particular rally leg could last another 3-5 weeks. Pure voodoo speculation.
Click here to open chart in new window.

Fibonacci projection targets for the $SPX using the July swing low, the August swing high and then the August swing low:
161.8% = 1231.15
200% = 1276.36
261.8% = 1349.49
And here’s where the Fibonacci projection gets interesting. If you use the swing low from March 09′, the swing high from April of 2010, and the swing low from July, you get a 61.8% projection of 1352. So now you have two Fibonacci projection targets that are in the same area. This is known as a confluence area. This area, should the $SPX get there, would offer up some pretty tough resistance and it may be difficult to get through. Assuming that $SPX even gets up into this area, then this area might be the place where a major pull back would start. That pull back would be necessary to build strength to through this confluence area. However, once through this area then $SPX 1350, or so, would provide major support. I wouldn’t expect $SPX to be anywhere near these areas for several months, if then, and, of course, this is all pure voodoo speculation for now but something to keep an eye on.
Next is a weekly chart of the $NYA from 2005 through the end of 2007. The main thing I wanted to point out is the RSI and the fact that the RSI rose up above 70 several times which would have certainly indicated a fast moving strong rally. Note also the number of times $NYA either tagged or pierced the upper BB’s and market reaction when this occurred in conjunction with the RSI being above 70.
Click here to open chart in new window.

Now for a current chart of $NYA that shows that the RSI has yet to rise above 70. My point is that there is still plenty of headroom for the market to move up through. The fact that $NYA closed outside the upper BB may mean it needs to cool off for a bit but it also indicates market strength.
Click here to open chart in new window.

Charts courtesy of StockCharts.com
Time:
$NYSI could take 3-5 or maybe more weeks to rise to the 1200 level, stall, and then roll over. $BPSPX could take 3-5 weeks to make the round trip from below 80 to above 85 and then back below 80. $NYA could take several weeks to get its RSI above 70, if it happens at all, and then have the RSI roll over and drop below 70. If all of the above were to happen in the time I’ve laid out, that would put us into early December which is about when a Santa Claus rally might be expected. Pure voodoo conjecture at this point but can’t be ruled out as seasonality favors longs for the next few months.
Finally, a chart of the SG for the $SPX showing that after falling in a down trending channel for the last couple of weeks, it has now apparently bottomed, broken out of the down trend, and is now in the first stages of a new up trend.
Click here to open chart in new window.

Based on the breakout in financials, the rising $NYSI, and the breaking of the down trend in the SG for the $SPX, I have fired up my portfolio over at The lion. Anyone who has been following this blog for a while knows that I tried to short IWM via TZA back when TZA was around $28. I took a $2 loss on that trade and that was the last time I tried shorting the market even though, based on breadth indicators, etc, I really believed the market was going to roll over. In my Lion portfolio I went in all short and that proved to be totally wrong. So instead of looking at the losses in that portfolio, I decided to delete the entire portfolio, including my good trades, and start over. In the next week or two I’ll be adding several more stocks and ETF’s to that portfolio many of which will be based on strong Relative Strength readings. Here is the link to my Lion portfolio, if you’re curious.
Good luck in the week ahead. As any paranoid trader knows, the market constantly presents dangerous opportunities.
Weekend Update October 30th, 2010
It’s election week and FOMC/QE2 week and without a crystal ball it’s anybody’s guess as to how the market will react to these events. Earnings may have more impact.
Couple of charts of the $NYSI.
This first chart is from April of 2010. It shows the $NYSI starting to roll over on the 24th of March. This was a slow roll and while the $NYSI dropped below the 5EMA at different times, the 5EMA managed to stay above the 10EMA until the 16th of April. On the 16th, the $NYA dropped about 135pts. From that point on until the market finally did roll over, the 5EMA stayed below the 10EMA. During this period of April there was a lot of euphoria with market participants certain that the rally would never end, but people watching the $NYSI and other breadth indicators knew that what was happening was more akin to Russian roulette.
I was watching the $NYSI and my own indicator during this period and I have to tell you that I began to doubt what I was seeing. The rally just went on and on and even though there were signs of weakness all over the place the rally really did seem indestructible. I feel that way now.
Click here to open chart in new window.

Now for a current chart of the $NYSI. You can see that back in August the $NYSI didn’t give any warning about what was going to happen. It fell off a cliff with the market. When the market bottomed three weeks later, the $NYSI with ADX and these ST EMA’s gave some good buy signals.
During the last couple of weeks, the $NYSI has been dropping and now the 5EMA is below the 10EMA and has been that way for the last two sessions. The questions I can’t answer with absolute certainty are whether or not history will repeat and whether or not market participants are playing a game of Russian roulette. But one thing I do feel certain of is that until the $NYSI and other breadth indicators start showing strength, then the chance that history will repeat is more likely than not.
Click here to open chart in new window.

Now for a weekly chart of $NYA:
There are some obvious signs of weakness on this chart but you just can’t read too much into them without some real evidence of selling, except maybe the Bearish Sto X. Back in April the Stochastic had a Bearish X during the week of April 19th. During the next week $NYA lost 201pts or 2.62% erasing almost a month of gains.
If you were to draw a trend line on this chart, you would notice that $NYA has broken the trend line, but this isn’t a decisive break. For now it is a warning, but, if in the week ahead, $NYA should close below 7417, then the break of the trend line takes on greater significance.
Click here to open chart in new window.

The following chart of $NYA is setup with what I call a mechanical trading system, or MTS. Its beauty lies in its simplicity. I’ve been working on this for several weeks and originally used only the 5EMA and the 20/20 Sto. I’ve added the 10EMA, which helps mute some of the movements in the Sto. There are several other indicators that will work with this setup, but for me the key is the 5/10 EMA’s. This is a work in progress but I think everyone needs a simple chart something like this. Maybe you’ll start with this setup as an idea and then put together something that works better.
Using this MTS, a buy signal is generated when after the %K has dropped below 20 it then begins to rise along with a rise in the stock, index, or ETF that takes the stock above the 5EMA. Confirmation of the buy signal comes when %K crosses above %D and the 5EMA crosses above the 10EMA. Sell signals come when the %K crosses down through the %D and then drops below 80. The sell signal is confirmed when the 5EMA crosses down through the 10EMA.
As you can see on the chart, $NYA is in the first stages of a sell signal but this is not yet confirmed by a 5/10 Bearish X. It is very close and any weakness in the week ahead will most likely end up confirming the sell signal. Until then, and IMHO, $NYA is a Hold but with caution.
Click here to open chart in a new window.

Charts courtesy of StockCharts.com
Finally a chart of the SG for the $SPX. This indicator is showing that there is underlying weakness in the market and that participants are at risk here. Even though the markets were essentially flat for the week, the SG lost quite a bit of ground. Until the SG stalls and reverses, caution is the word of the day. I want to point out that back in the March/April period the SG started giving warning signs long before the rally ended and that is why trend lines on daily charts are so important at the moment. Don’t get caught on the wrong side of the trade when or if trend lines break while the $NYSI is flashing warnings and the SG is falling, IMHO, of course.
Click here to open chart in new window.

Be careful in the week ahead. Could be a moon shot or Armageddon. Probably won’t be much more or any of this sideways action.
Lowry’s is updated. Not much change.
If you are not paranoid, please seek professional help immediately.
GL
Weekend Update October 23rd, 2010
Bulls vs Bears
Before I get started, I want to point out that while I would love to see a pull back of several percentage points I am not looking for nor do I expect any kind of bearish crash scenario. A 50% retrace of this latest move would take the $SPX down near the 50MA and that would be great. Pull backs are healthy and cleansing for the market as they give participants a dose of reality. If the rally is indeed strong and lasting in nature then it can certainly endure a pull back, should one materialize.
$USD doesn’t go in either category for the moment as the G20 meeting this weekend will probably play a role in its direction, so it’s a wild card.
Bullish:
Trend lines continue to hold and that’s really all that matters. MACD Bearish X’s, DI line Bearish X’s are merely cautionary events without a failing trend line. Sometimes markets correct through time rather than price and a MACD Bearish X becomes a MACD Bullish X in time. $SPX, $NYA, $INDU, & $RUT all have MACD Bearish X’s now but nothing has come of this yet. Momentum may be on the decline, but it hasn’t left to the point where trend lines are failing. Until then, party on.
50MA crosses up through the 200MA on the $SPX, $COMPQ, & IWM, though not the $RUT. Thanks, Chris.
$SOX index rises 2% on Friday based on earnings from SNDK, I think, though SNDK did close in the red. If $SOX can take out the recent swing high of 358.47 on a closing basis, then this will doubtless have a positive effect on the $COMPQ, $RUT, and to a lesser extent the $INDU.
Huge short positions in the ES and NQ futures contracts continue to provide fuel for every step higher as shorts are forced to cover.
$NYUD, the cumulative, looks okay here. It needs to get some mojo or it risks rolling over. Click here to open chart of $NYUD in new window.
$BPSPX continues to climb. It did waffle on Tuesday which created a down tick on its Stochastic. The Stochastic is now trying to right itself but I hold that as long as the Stochastic continues to waffle then entering new long positions at this time is risky. This was the case for last week.
$SPXA50R is at 88.40% and somewhat stable. It appears to have peaked but hasn’t really lost much ground since doing so.
P/C Ratio at .87 is slightly bullish.
$VIX has dropped for the last three sessions and could easily take out the recent low of 17.90. $VIX:$VXV doesn’t appear to be a factor at the moment.
$NYAD, the cumulative, closed at a new high on Friday while $NYA missed making a new closing high by less than a point. You could say this is positive divergence between $NYAD and $NYA, but it’s really too close for me to call.
$NAUD, the cumulative, made a new high on Friday while $COMPQ missed making a new high by a little more than a point. Again, you could say this is positive divergence, but for me it’s too close to call.
Earnings keep coming in better than expected, of course. Stocks that beat their already lowered estimates are being hugely rewarded but this is a double edged sword. If this trend continues, then these earnings will bolster the rally. On the other hand, if some influential heavy hitters start missing, the way GE did, then that probably won’t be looked upon very well.
Bearish:
AAPL . Something going on with this stock. Maybe just a one-day pull back, but if profit taking in AAPL continues, then it could pull the market down with it.
Volume. Where is it? Indexes had volume close to what it was on October 11th, which was also in extremely light volume day. IWM volume was the lowest of the year. If there are buyers out there, then why isn’t their presence showing up in volume?
Lowry’s issues a new ST sell signal this past Tuesday. See Lowry’s Data for details.
$NAAD misses making a new high by 500pts while $COMPQ barely misses making a new closing high Friday.
Lower highs for many indexes, including $RUT. But no lower lows yet.
XLF closed flat Thursday and Friday. How is that even possible? Financials continue to weigh down the markets.
Click here to see Cobra’s warning that Friday was an All Up Day. He says that this particular set up hasn’t failed since 2007 in bringing about a red day in the following session.
Zweig Breadth Thrust is not really confirming the last several days of this rally.
$NYHGH went to 404 on 10/13 and has been putting in lower highs since. It took quite a hit this past Friday as the $NYA seemingly rallied. The silver lining with $NYHGH is that it is putting in higher lows.
$NAHGH also put in a rally high on 10/13 and hasn’t matched that since. More troubling, though, is the fact that it dropped this past Friday while the $NDX and $COMPQ rallied.
$NALOW rose by one issue to 27 on Friday. 27 is more or less neutral, but this needs to be watched.
$NYSI, the Big Daddy of breadth indicators, has had down ticks for 5 out of the last 6 sessions. This is a warning that breadth is deteriorating but it is clear that breadth has not deteriorated to the point of causing the market to roll over. $NYSI can reverse and a new rally leg can start at any time. If you traded solely on $NYSI weakness back in March/April, you would have missed a good part of the rally, but all of the decline.
The following chart shows what longs are up against now. $NYSI can flat line for a while longer, like it did in March/April, or it can fall off a cliff, like it did in June and again in August.
Click here to open chart in new window.

Last weekend I said that I thought we could get two more weeks out of the rally. I also said that I thought this coming week would be choppy. Well, last week the rally did not live up to my expectations. I thought the markets would rally hard, get the bulls to the frothing-at-the mouth level of euphoria, and help set the stage for a pull back, none of which happened. Regardless, I still think the market will be choppy this coming week, and it may actually pull back, though I will believe that when I see it.
Finally a chart of the SG for the $SPX. After essentially flat lining for a month, the SG has finally broken out of that parallel channel and is now in a down trend. This indicates that the strength necessary to keep it in this holding pattern is waning. Longs will want to use extreme caution until the SG bases and then reverses, which could happen at any time.
Click here to open chart in a new window.

For people new to the blog, you can click on the spreadsheet link in the Blogroll section and follow this on a daily basis and make your own charts. I usually update the data each evening.
If you’re not wearing your paranoia on your sleeve, where are you wearing it? And never forget that money in the market is money at risk.
GL in the week ahead.
(Added at about 2:20pm, Sunday October 24th:
If you don’t already visit Trader’s Narrative to read the weekend post, you are missing out. Click here to open link in new window, and be sure to bookmark the site.)
Update October 21st, 2010
No question in my mind that THEY are moving the market around with the $USD. Back on August 10th, I got a buy signal on the dollar and that marked the top for equities. Then on September 1st, I got a sell signal on the $USD, which marked the bottom for equities. I have seen this correlation between equities and the dollar work perfectly in the past and I’ve seen it completely fail. For the buy signal on the $USD to remain valid, it needs to stay above 77.40 or so. If it does, and if it goes up from here, then there is a chance that equities will be under pressure until the dollar gives a sell signal. All of which remains to be seen.
Two charts of IWM in 120min time frame:
Yesterday’s showing Bull Flag pattern.
Click here to view chart in new window.

Today’s showing IWM’s failure to break out of Bull Flag pattern on a closing basis.
Click here to view chart in new window.

Charts courtesy of FreeStockCharts.com
Next, two charts of $NYSI:
First is from yesterday showing signs of weakness as $NYSI drops below 5EMA. The way this is supposed to work and the way this has worked historically is that you do not want to be on the wrong side of the $NYSI. If it’s falling, then being long will be painful, and vice versa.
Click here to view chart in new window.

Today’s chart showing further weakness. I said over the weekend, after getting a down tick in the $NYSI last Friday, that three days of down ticks could be a problem and now we have that. We’ve also had three distribution days out of the last five sessions. You don’t really see this unless you look at $NYA which is heavy with commodity stocks and so $NYA will have a much more obvious and negative reaction to a rising $USD than the other majors.
Click here to open chart in new window.

Charts courtesy of StockCharts.com
Click here for chart of CVI, which looks to be getting ready to take out the next support level.
Lot of stuff going on in the AH but I think the key for tomorrow and the next few days is the $USD.
Only the paranoid survive.
