Charts, Etc, Week of August 30th, 2010
(Scroll down to see posts for Tuesday, Wednesday, etc.)
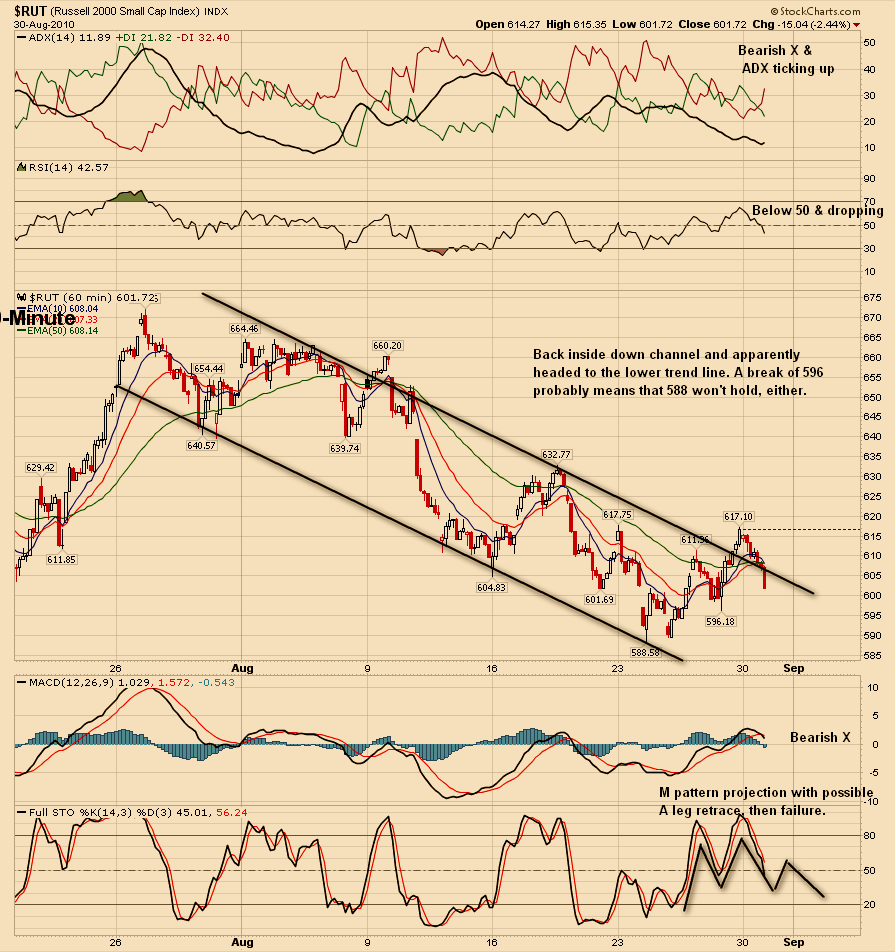
Monday, August 30th, 2010
14 vs 1
The fact that Friday’s 90% up day did not or has not yet shifted momentum from down to up, should be more than bothersome to longs.
Click here for updated, longer term, 60min $RUT chart.
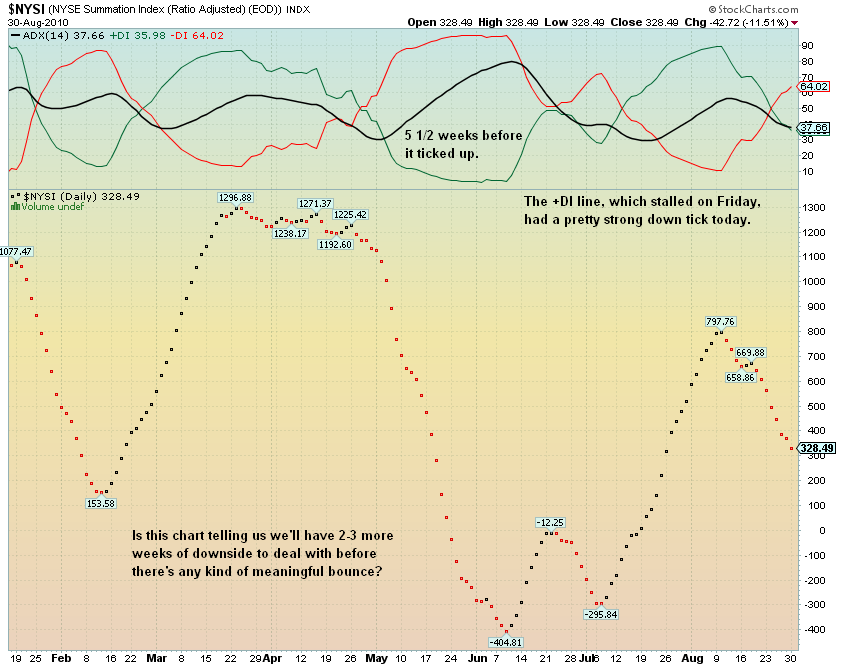
The Summation Index had a pretty strong down tick today and is well below 500.
Click here for updated $NYSI chart with ADX.
Added about 7:40pm ET
$NYUPV closes at 57.55. Lately this has only slowed the downward action. Will it be different this time? Another problem with this low reading is that readings like this on Mondays are less reliable than any other day, IMHO, of course.
The momentum indicator on the SG for the $COMPQ, which I only track visually these days, is slowing its descent noticeably. Tomorrow will be key for this one.
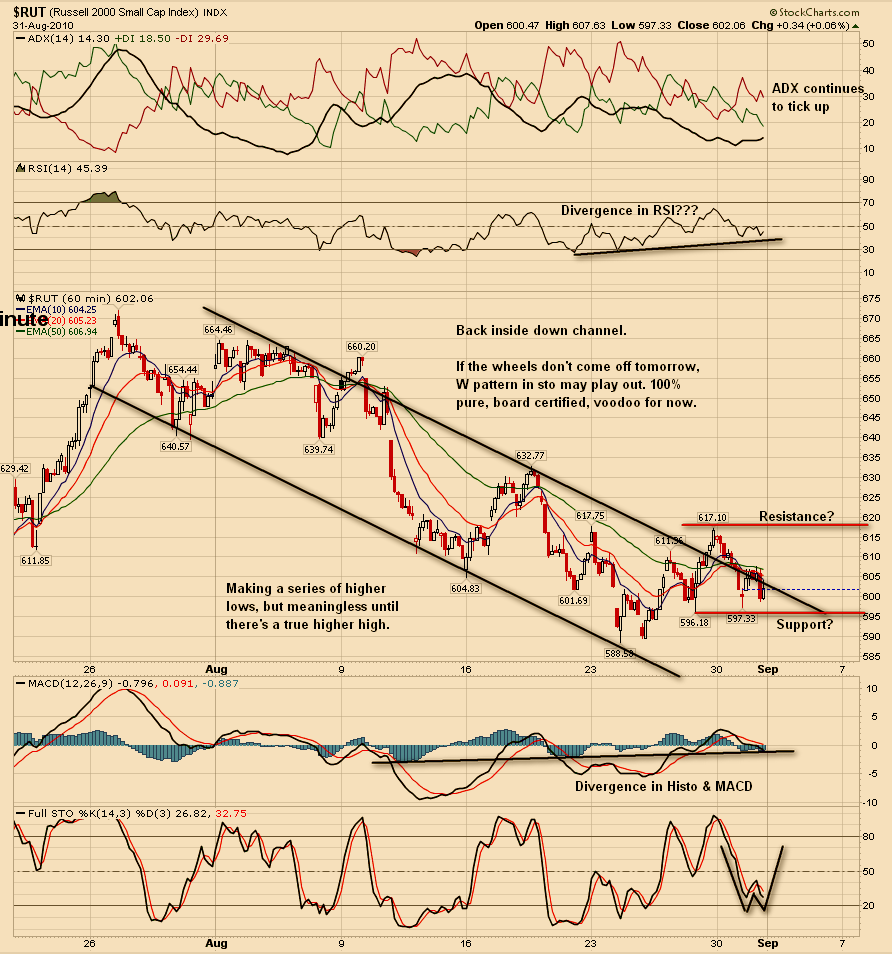
Tuesday, August 31st, 2010
14 vs 2
Click here for updated longer term, $RUT/IWM 60min chart.
The ADX line on IWM’s daily chart has been dropping since last Friday, which doesn’t mean much right now and may not be meaningful going forward.
The momentum indicators for the SG’s for the $SPX and $COMPQ are noticeably slowing their descents. A rally of 20-30pts, or more, on Wednesday could stop these or possibly reverse these. But this is speculation for now.
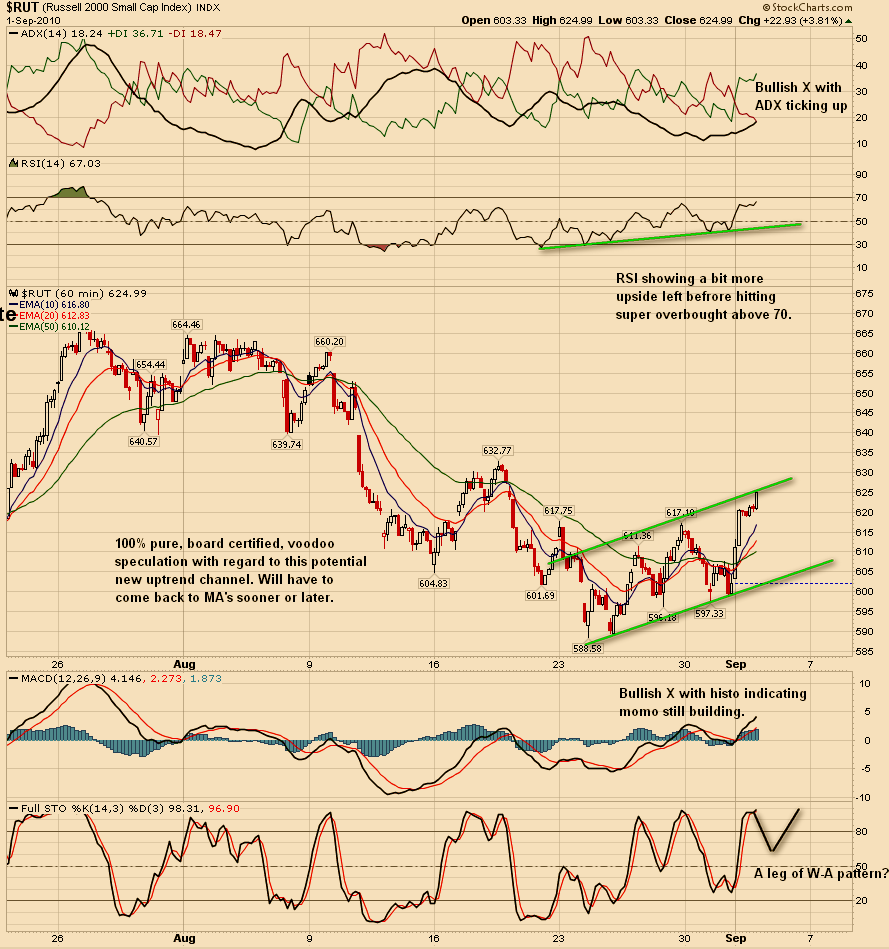
Wednesday, September 1st, 2010
14 vs 3
Crazy but indicative of the kind of market we’re in. A 90% up day on Friday followed by a 90% down day on Monday, followed by a 90% up day today. I don’t know if today’s action confirms Friday’s or if the count has to start all over again. Having the 90% down day on Monday really screws things up. Closing $TICK of 1287 says a lot. I have never seen the $TRIN sit in the .30 and .2x area for an entire session. Major short squeeze with longs scrambling to get in. Bullish MACD X’s and Bullish DI X’s all over the place. Could all come unglued tomorrow, for all I know. Key will be if Initial Claims come in higher than expected and market ingores this, then you know for sure that mood of market has changed. I think the mood has changed, but Dorothy won’t come off the mojo so I remain totally clueless.
Click here for updated, longer-term, $RUT/IWM chart showing a potential new uptrend channel.
Be sure to check $NYSI & $NASI w/ADX. Interesting.
SG stuff: All four of the indicators that I use for the SG’s for both the $SPX and the $COMPQ ticked up today. Usually at the end of one trend and the start another, first one and then another and another of the indicators will tick up or tick down, depending on the current trend. I’m not 100% sure because I haven’t had time to check, but I think today’s action with all four changing direction on the same day is a first.
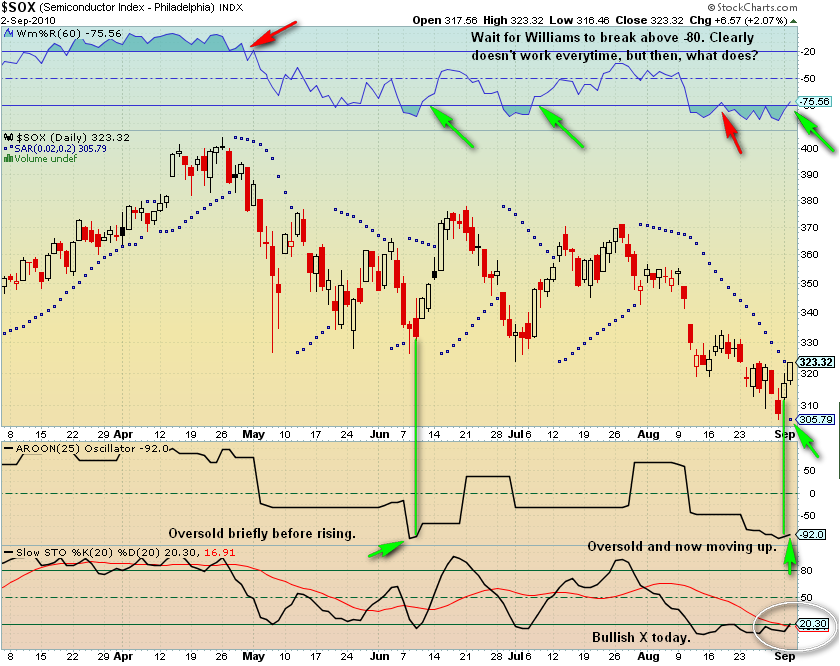
Thursday September 2nd, 2010
14 vs 4
$COMPQ close at round # 2200 is voodoo in its purest form.
Another simple chart. Taking profits tomorrow.
