Archive
Charts, Etc, Week of August 30th, 2010
(Scroll down to see posts for Tuesday, Wednesday, etc.)
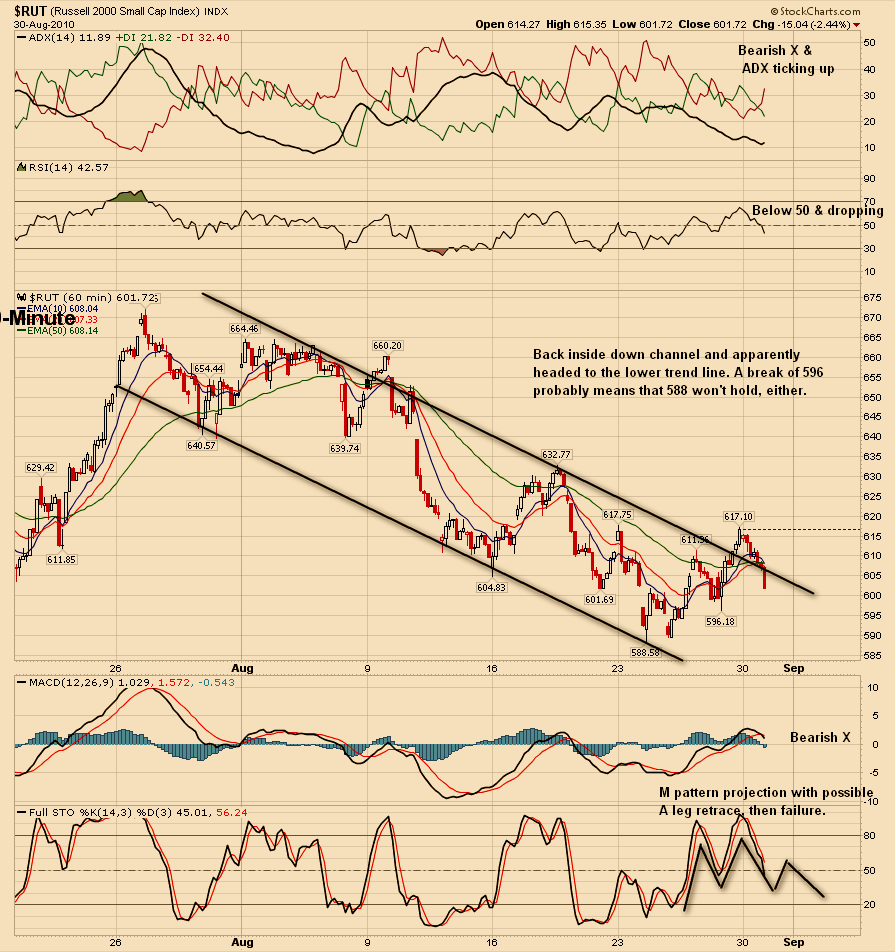
Monday, August 30th, 2010
14 vs 1
The fact that Friday’s 90% up day did not or has not yet shifted momentum from down to up, should be more than bothersome to longs.
Click here for updated, longer term, 60min $RUT chart.
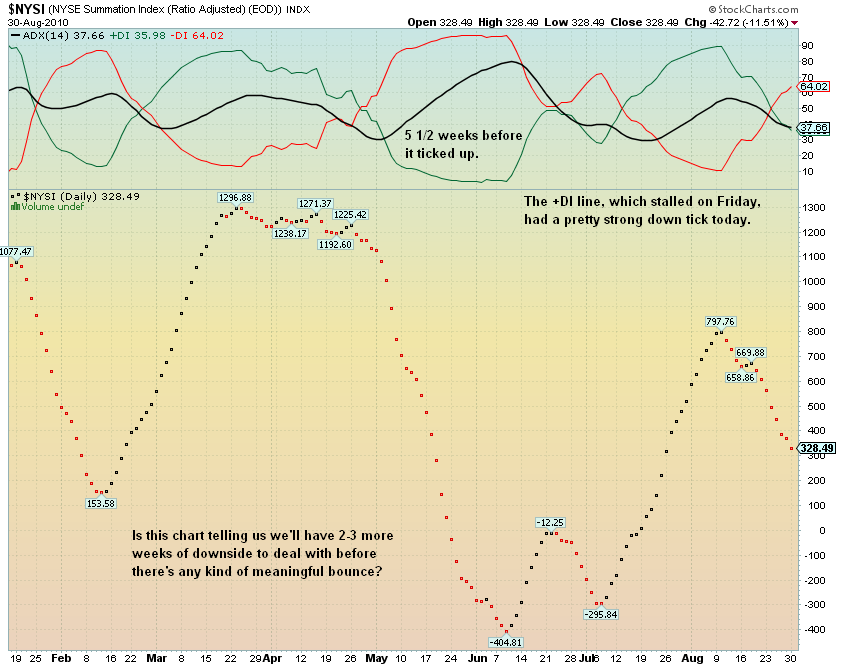
The Summation Index had a pretty strong down tick today and is well below 500.
Click here for updated $NYSI chart with ADX.
Added about 7:40pm ET
$NYUPV closes at 57.55. Lately this has only slowed the downward action. Will it be different this time? Another problem with this low reading is that readings like this on Mondays are less reliable than any other day, IMHO, of course.
The momentum indicator on the SG for the $COMPQ, which I only track visually these days, is slowing its descent noticeably. Tomorrow will be key for this one.
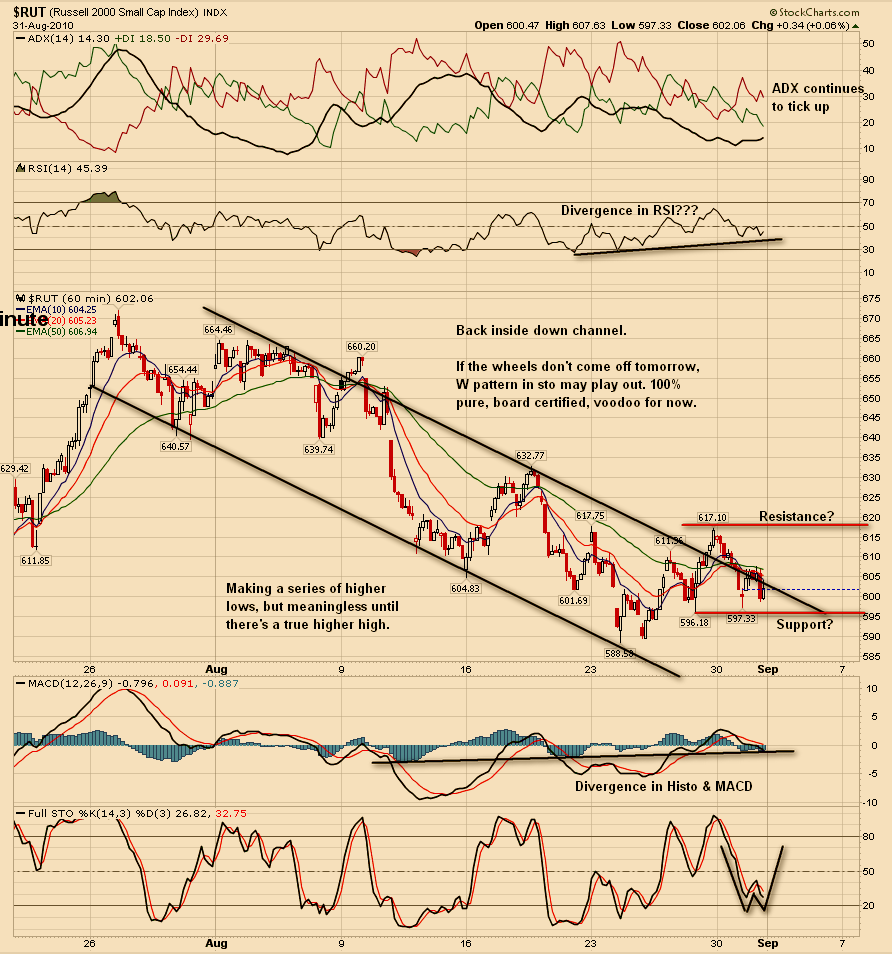
Tuesday, August 31st, 2010
14 vs 2
Click here for updated longer term, $RUT/IWM 60min chart.
The ADX line on IWM’s daily chart has been dropping since last Friday, which doesn’t mean much right now and may not be meaningful going forward.
The momentum indicators for the SG’s for the $SPX and $COMPQ are noticeably slowing their descents. A rally of 20-30pts, or more, on Wednesday could stop these or possibly reverse these. But this is speculation for now.
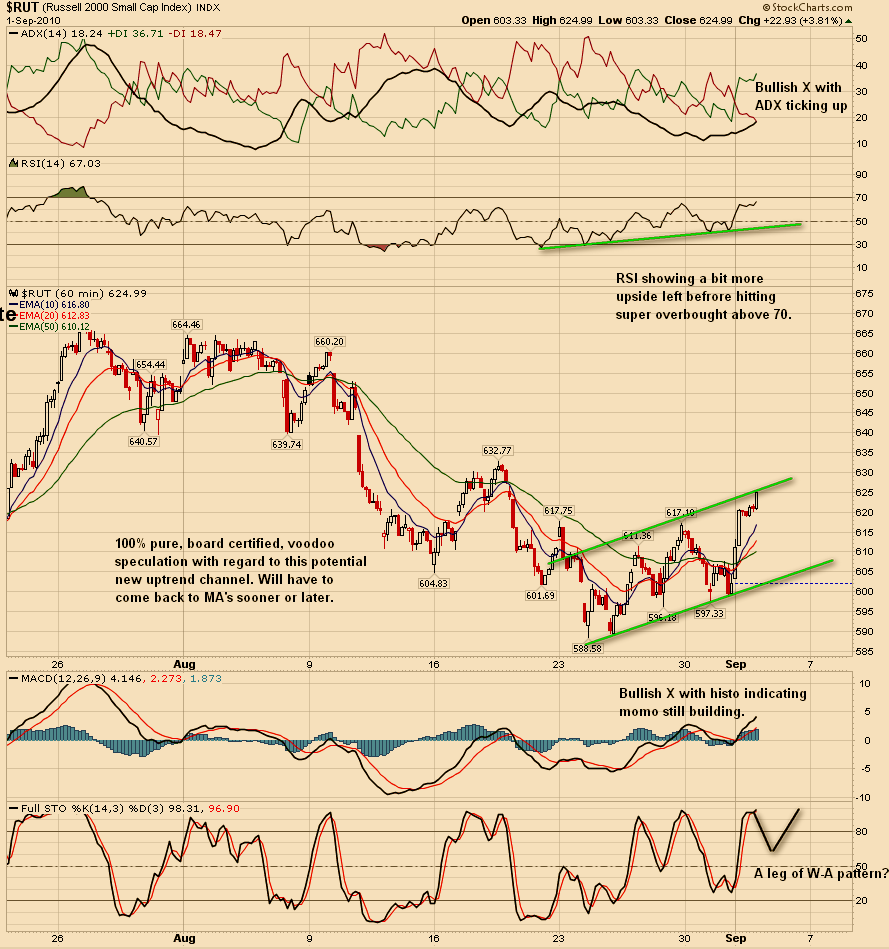
Wednesday, September 1st, 2010
14 vs 3
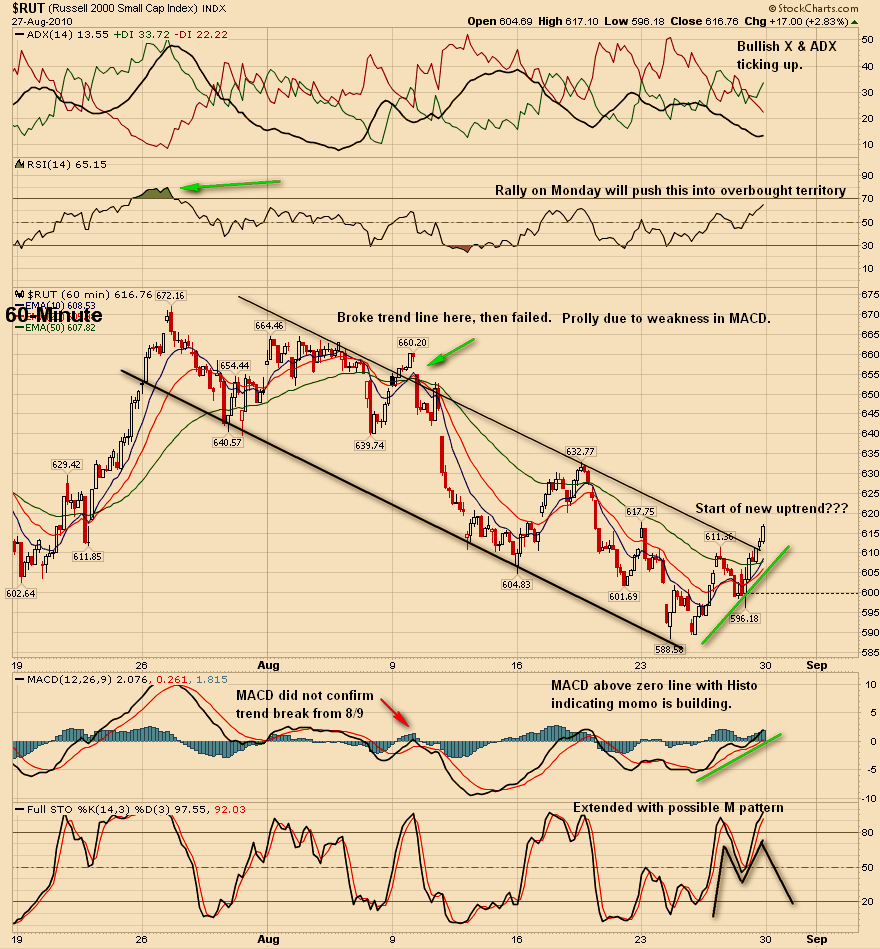
Crazy but indicative of the kind of market we’re in. A 90% up day on Friday followed by a 90% down day on Monday, followed by a 90% up day today. I don’t know if today’s action confirms Friday’s or if the count has to start all over again. Having the 90% down day on Monday really screws things up. Closing $TICK of 1287 says a lot. I have never seen the $TRIN sit in the .30 and .2x area for an entire session. Major short squeeze with longs scrambling to get in. Bullish MACD X’s and Bullish DI X’s all over the place. Could all come unglued tomorrow, for all I know. Key will be if Initial Claims come in higher than expected and market ingores this, then you know for sure that mood of market has changed. I think the mood has changed, but Dorothy won’t come off the mojo so I remain totally clueless.
Click here for updated, longer-term, $RUT/IWM chart showing a potential new uptrend channel.
Be sure to check $NYSI & $NASI w/ADX. Interesting.
SG stuff: All four of the indicators that I use for the SG’s for both the $SPX and the $COMPQ ticked up today. Usually at the end of one trend and the start another, first one and then another and another of the indicators will tick up or tick down, depending on the current trend. I’m not 100% sure because I haven’t had time to check, but I think today’s action with all four changing direction on the same day is a first.
Thursday September 2nd, 2010
14 vs 4
$COMPQ close at round # 2200 is voodoo in its purest form.
Another simple chart. Taking profits tomorrow.
Weekend Update August 29th, 2010
(3:15pm ET. Added a Zweig Breadth Thrust chart at end of this post.)
Anyone else watching the Vuelta?
At this link, which you should bookmark, you can clearly see that Friday was a 90% day with 84% of stocks in the advance column. When the market came off the bottom in July, it did so with a 90% up day that followed a 90% down day. BTW, I would feel much better if Friday’s rally had been preceded by a full on, major distribution event. Probably a chance we still might get one.
On July 7th, we had that 90% up day and this was followed by another 90% up day on July 13th. Sometimes these 90% up days can be exhaustion days, and that’s more or less what July 13th was. On a closing basis, the $SPX, only rose another 32 points before stalling and rolling over.
The Feb rally also started with a 90% up day that followed a 90% down day. On Thursday, 2/4, the $SPX dropped 35pts and in the process washed out a huge number of longs. Then on Tuesday, 2/9, you had a 90% up day and this was followed on 2/16 by another 90% up day. From the closing high on January 19th it took the $SPX 14 days to drop to the closing low of the move on February 8th. Once the bottom was in, it took the $SPX 22 days to get back to the January 19th level. Obviously the market climbs a wall of worry a lot slower than it falls off a cliff.
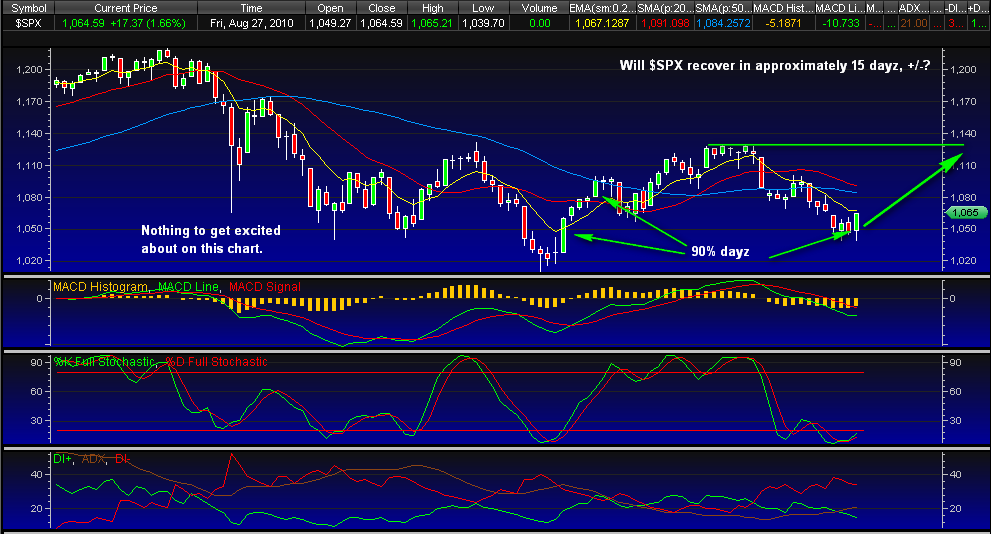
The current situation is that from the $SPX close at 1127.79 on Monday, August 9th, the $SPX fell 13 days to the recent closing low of 1047.22 this past Thursday, August 26th. Assuming that the closing low is in for this down leg, then it should take the $SPX somewhere around 20 days to get back up to the 1127 level. If this up moves starts to drag on and on, which it might since September has such a bad reputation, then this will be evidence of core weakness within the market. The left side and right side of the chart don’t need to match but they should resemble each other.
Recent history suggests that there will be another 90% up day coming in around 6-7 days. If we do get one about then, be extra krispy watchful of what happens in the days immediately following such a day.
This chart shows the possible course the $SPX may take over the next few weeks, all 100% pure, board certified, voodoo speculation.

Click here for a direct link to the chart above.
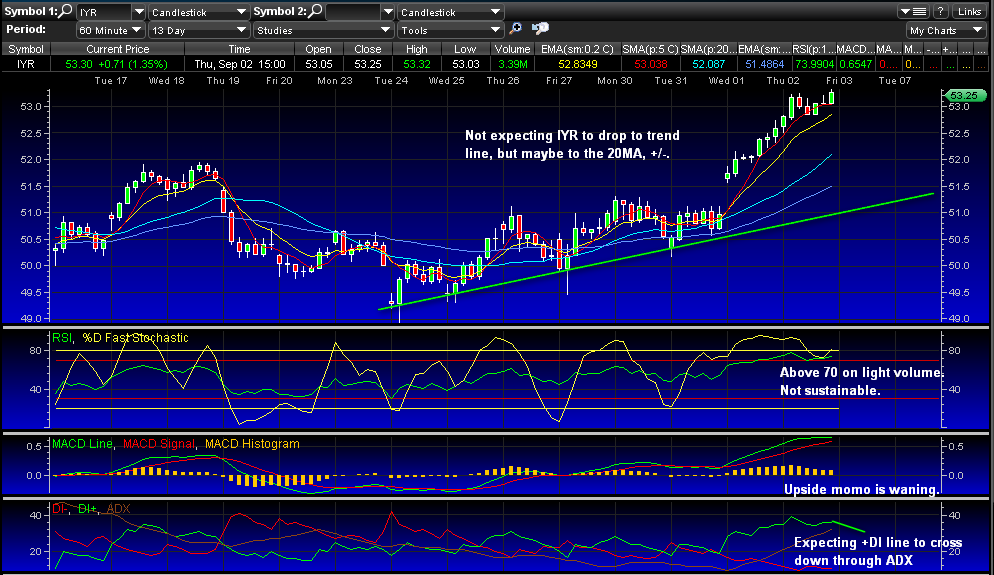
I did pick up some DRN on Friday as soon as I recognized the potential for a 90% up day. I was watching this 60min chart of IYR and the symmetrical triangle that was forming. It appeared to me at the time that IYR would break out of the top of the triangle rather than the bottom. The top side break out means one thing and one thing only: The Pro’s bought the close.

Longer term 60min chart of IYR.

Chart courtesy of FreeStockCharts.com
Daily chart of IYR showing that IYR is now back above the 50MA and the 9EMA and is less than 30 cents away from getting back above the 20MA. A break of a trend line is a good thing, but for me I need to see a Bullish MACD X early in the coming week.

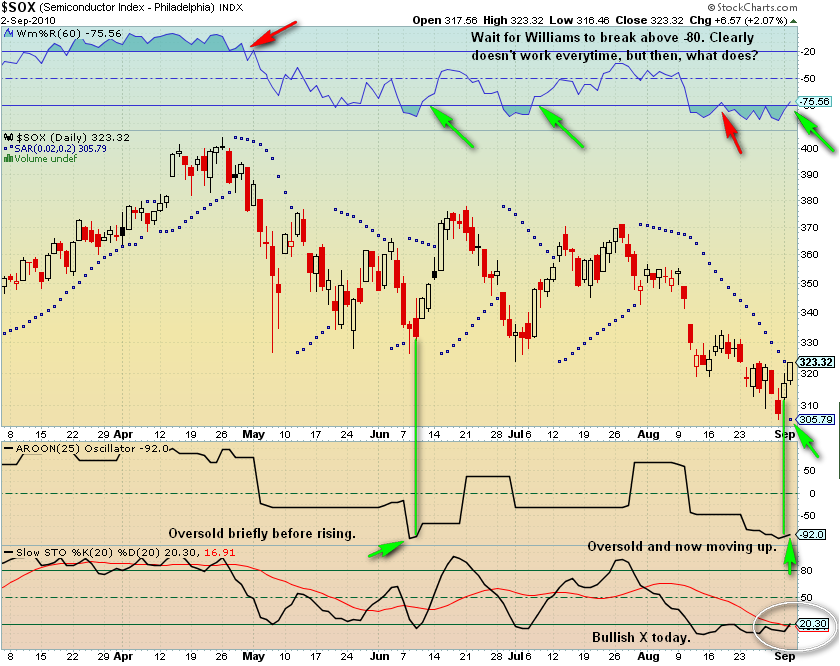
I also bought some SOXL mainly because the $SOX has been so beaten down and also because of the huge volume spike in SMH this past Friday. But I have to tell you that, other than some positives in the 60min time frame and that huge volume spike on the daily chart of SMH, there isn’t much going for the $SOX right now.
Chart of $SPXA50R that I’ve been watching over the past week or so. I fully expected $SPXA50R to drop well below the 25% line before there was any chance for the market to put in a ST bottom. Still could happen.

Chart courtesy of StockCharts.com
Chart of SG for $SPX showing slight uptick Friday. A couple more upticks, and the SG will break the trend line and start a new uptrend, which I would certainly like to see.

No Lowry’s data again as Puplava and his crew probably won’t be back until after Labor Day. Lowry’s is all about 90% days so I have to think, until I find out otherwise, that Lowry’s has issued a ‘buy’ signal based on Friday’s action.
I use ZWB just to show overbought or oversold, but click this link for more ways to use it.

Update August 27th, 2010
14 vs 0
$SPX made an intra-day high on Monday, August 9th of 1129.24. Today, 14 dayz later, $SPX made an intra-day low of 1039.70. If we have bottomed, for however long that may be, then $SPX should not take out 1039.70 before it takes out 1129.24. Since I think we’ve just put in a ST bottom based on what appears to be close to a 90% day, I’m going to count the dayz until $SPX breaches 1129.24. If this breach happens in or around 15-20 dayz, then that will indicate market strength and the rally that it will take to get up there will most likely continue. If, on the other hand, the market drags ahead and isn’t even near 1129.24 in the 20th or 25th day, then longs will need to watch out.
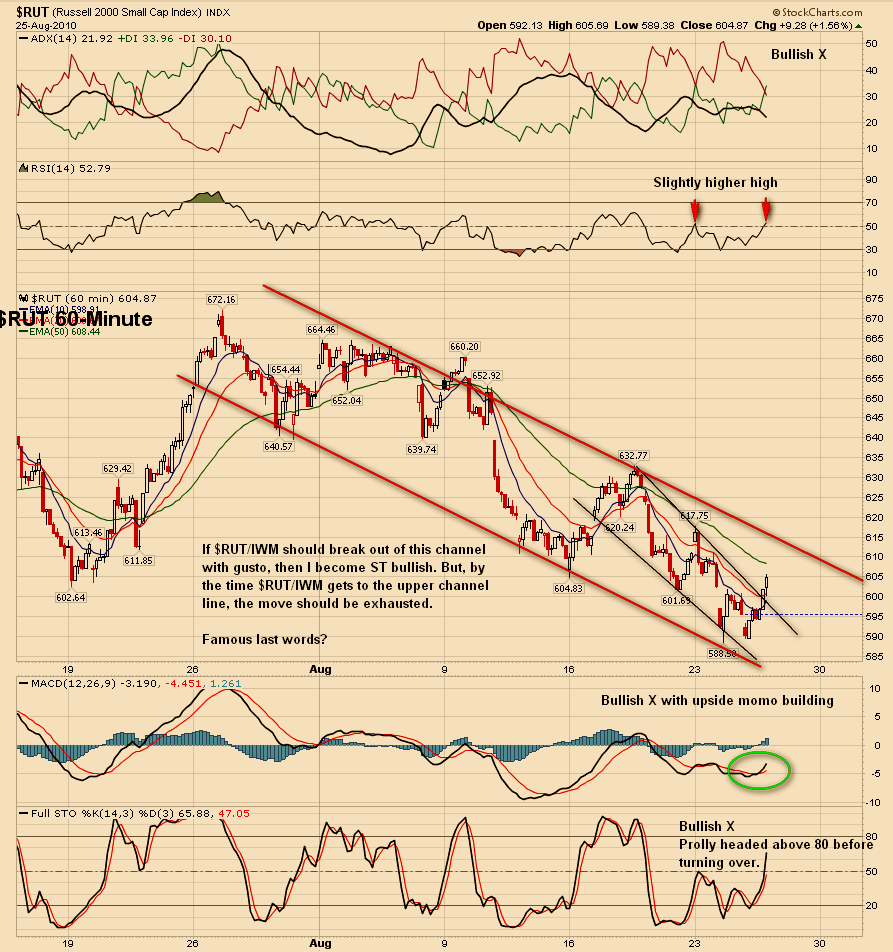
I said the other day that if IWM broke out of the down trending channel with gusto, then I would become ST bullish. Got my wish and so I’m bullish for now. But before you get your ya ya’s out, we will need some kind of convincing, IBD-type, follow-through day next week, preferably mid to late week.
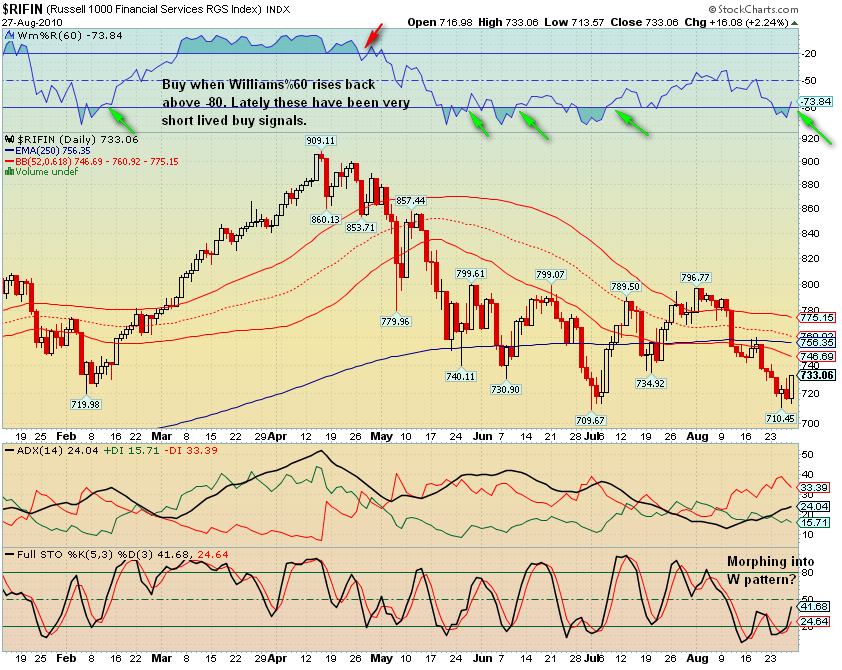
Take a look at SMH with the same setup as the chart below. These two sectors have been weights on the market and they may have just bottomed, and then again, a rising tide lifts all ships. Other sectors appear to have put in a double bottom test and that is about as good as it gets, IMHO, of course, which I’ll change at any time without telling you.

Chart courtesy ofStockCharts.com
Click here for a direct link to the chart above.
I think that the momentum indicator that I use for the SG may have either stalled today or ticked up. I’ll let you know.
$NASI w/ ADX stuff:
Yesterday, Thursday August 26th, the +DI line had a reading of 31.66. I haven’t been checking daily changes, but I imagine that this has been dropping by close to a point per day over the past couple of weeks. Today’s +DI reading is 31.53, a drop of .13. Plus, $NASI went more or less flat today. $NYSI w/ ADX doesn’t look quite as good but the $COMPQ has been leading this decline, thanks mostly to weakness in the semi’s. I don’t want to read too much into this setup because it’s sooo voodoo, but right now it is signaling a potential shift in momentum.
Update August 26th, 2010
9 vs 39
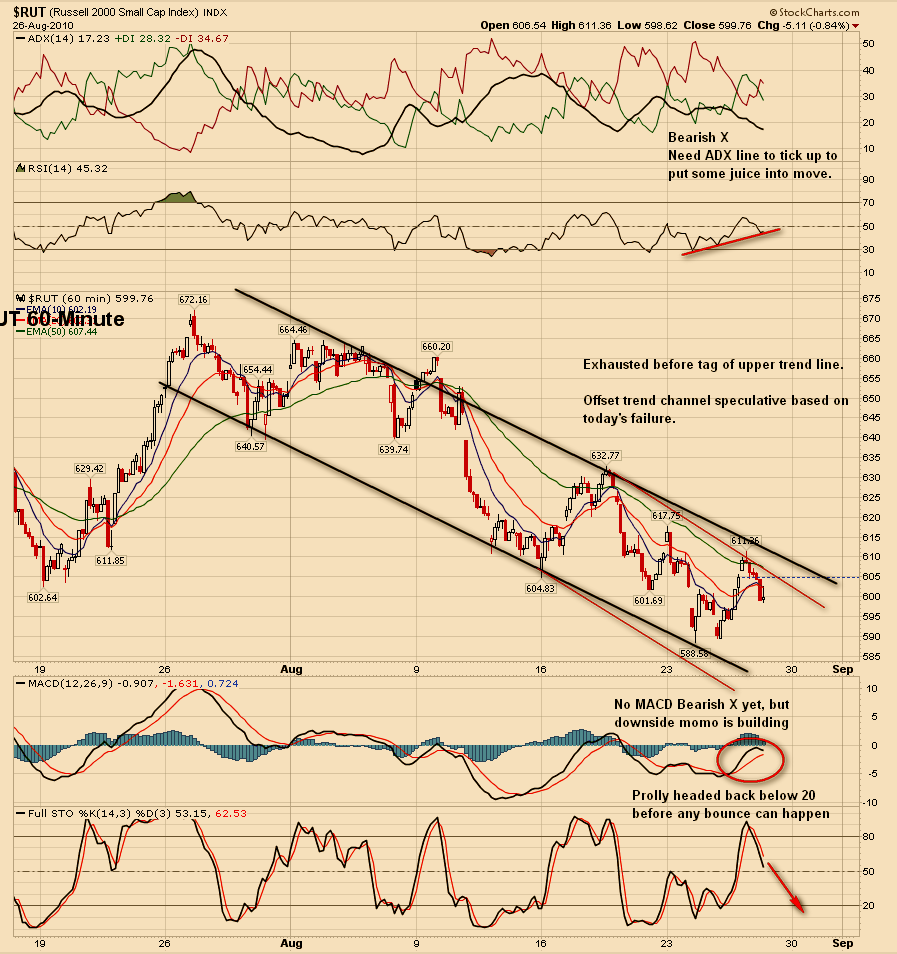
Click link for updated, longer term, 60min $RUT chart.
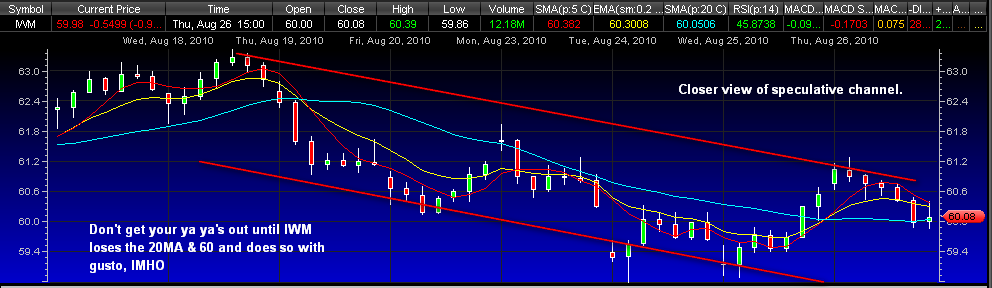
Click this link for closer view of IWM 60min chart.
GL
Midnight Update August 25th, 2010
9 vs 37
5:15pm 8/25/10. Updated $RUT/IWM chart.
Okay, so I said I wasn’t going to post for a while and no this doesn’t mean I got my mojo back, I’m just seeing a few indicators, like $VIX outside upper BB’s, $NYMO almost to its lower BB, and a few other things that suggest the market is oversold enough now to initiate a bounce. The last time some of these flashed the same level of extreme oversoldness, the market didn’t do much, so your mileage may vary and you need to be fast to profit from it. Any bounce will most likely be contained within the context of the persistent down trending channel, until proven otherwise, and I’ll be looking to short it once the upper trend line is tagged.
This chart of $RUT shows a falling wedge pattern in the middle of the channel. If the $RUT/IWM can break out of this wedge, then IWM could try to make a run for the $61 upper trend line. It won’t be easy. A lot of bulls are trapped overhead at every level and they’ll be happy to sell into any pump and worry about it later.

Chart courtesy of StockCharts.com
This chart of TWM shows how TWM has been rising to the upper trend line and then pulling back to the lower trend line, and then rising back up. Will this repeating deja vu pattern repeat again?

In general, the market is back to where it was in the first week of November, 2009. 10 months of hard won gains evaporated.
One of the indicators for the SG is showing that negative strength continues to build but it has not built up enough to signal that it has climaxed. Perhaps the light volume has something to do with it. I don’t know.
The $NYSI with ADX got a Bearish X today. This is telling me that in about two weeks, +/-, we should get a decent bounce.
$SOX, $CYC, RTH, IWM & XLF, and probably a couple of others, are within a hare’s breath of entering a Bear Market phase. I don’t see how they can avoid it. How long before other key sectors do the same?
BTW, when I said in my Monday post that the top is in for 2010, this is not based on any E Wave voodoo TA, not on any economic expectations, not on some Fib retrace, or some prognostication by some perma-bear. No. It is based soley on the change in market dynamics, this new paradigm, the foundation of which is the internal structure of the market and the lack of strength and participation evident there in.
And this time it really is,

I might put up something over the weekend.
Update August 23rd, 2010
At the close:
Weekend Update August 21st, 2010
I decided to experiment with a different format that allows for full-size charts without having to right click on them.
Click on this link to get to my weekend post.
Like to get some feedback on the type of candle that is on the XLF weekly chart. Many of the weekly charts have what appears to be a gravestone doji reversal candle, including $COMPQ, $SPX, and $TRAN, but these are questionable.
Last weekend I picked on the $SOX index, and it was up 1.6% for the week. This week I kinda’ pick on XLF. Just sayin’.
No Lowry’s this week and probably next. I think they’ve taken the rest of the month off and may not be back until after Labor Day.
Quick Update August 20th, 2010
Bottoming tails everywhere suggest there will be a rally on Monday plus Mondays have been fairly consistent as rally dayz over the past few weeks, so there you go. $NYUPV buy signal in place? Not so sure. Market bounce today was technical coming from extreme oversold RSI below 30 in the 15min and 60min time frames, IMHO, of course, meaning it was a short squeeze.
There are now Aroon Bearish X’s on the daily charts of several key sectors and indexes, including XLF, $COMPQ, $RUT/IWM, $SOX, and $CYC is likely to have one next week.
IWM and just about everything broke their down trend line on their 60min charts so they’re ‘buys’ right?

Not so fast. This chart of $RUT shows the real issue. Maybe $RUT/IWM can break out of this channel, but the daily and weekly charts don’t look so hot so maybe not. From the way that channel is falling, it doesn’t look like we’ll know until at least Wednesday or Thursday.

$NASI with ADX did have a Bearish DI X today, and the way things are going $NYSI could have experience the same thing by Tuesday or Wednesday, plus it looks like $NYSI is headed back into the 500’s next week and that is just not a good thing.
Stay on your toes.
Pre-Market Update August 20th, 2010
No crystal ball here, but I see this as a possible scenario for Friday.
(Added at about 9:00AM Friday morning:
I put up the chart of IWM last night after midnight ET and it appears that IWM and others are going to fall off a cliff at the open. Be careful trying to short into the drop because the Big Boyz might be setting you up, as THEY have done so many times in the past. However, be even more careful trying to buy the dip.)

Update August 19th, 2010
Before I get this rant started, I just want to point out that in last night’s post I mentioned that we wouldn’t be seeing any P/C ratios in the .6x area, and THEY opened the intra-day P/C ratio at .69 today. Which one of you ratted me out? Bastages.
$NYUPV closed at 82.xx today, which is just above the important 80 level. Does that get me excited about a possible bounce? Absolutely not. The last $NYUPV bounce is over after only a couple of days and any $NYUPV bounce that happens from this low reading is likely to fail, if it even happens. Go back and look at $NYUPV from 2000 to the present. You will see something very interesting.
There are a hundred reasons why I’m not going to try and catch this next $NYUPV bounce, if it even occurs, but the main reason is the Summation Index for the $NYA, which took a pretty good hit today and knocked the McClellan Oscillator back into negative territory. The other day I said it bothered me to be trading opposite a falling Summation Index, and then the index rose. But now it’s falling again.
This chart of the $NASI is another reason why I’m not ready to play Russian Roulette with this market. There is no way I would want to wait around for those DI lines to cross, which is bound to happen Friday. No way.

Another reason is because of what they did to the Big Daddy today, the transportation index. $TRAN came down with way too much volume. Capitulation volume? You make the call.
Look at that beautiful M pattern in the Sto, which is now finishing up the the first part of the A leg. The black line is the projected course the sto will take once the up portion of the A leg is complete, which may have happened today.

Another chart of $TRAN with TROUBLE written all over it.

Charts courtesy of StockCharts.com
Chart of IWM, but it could just as easily be the Q’s, SPY, DIA, XLF, IYR, or RTH. The point is that all of the above broke their trend lines and the 20MA and closed below them. I exited TQQQ and UWM when that happened and rolled into some TZA with plans to add more on any pop. But my plans may change at any time. I may just go to cash and watch from the cheap seats.

Only the paranoid survive.
